This post provides summary metrics we look at to gauge GiveWell’s influence and growth. Our full annual review and plan will follow over the next few days.
Summary
- We tracked over $1.5 million in donations to top charities in 2010, compared to just over $1 million in 2009.
- Our website traffic nearly doubled from 2009 to 2010, and donations through the website nearly tripled. Our overall increase in money moved appears to be driven mostly by (a) a gain of $200,000 in six-figure donations; (b) new donors, largely acquired via search engine traffic and the outreach of Peter Singer.
- Our growth in online donations to recommended charities was significantly faster than that of the more established online donor resources (Charity Navigator and GuideStar); our total online donations remain lower than these resources’, but are now in the same ballpark.
Total money moved
One of our primary metrics is “money moved”: donations to our top charities that we can confidently identify as being made on the strength of our recommendation. We are generally very conservative in identifying “money moved”; full details of how we track it are at the end of this post.
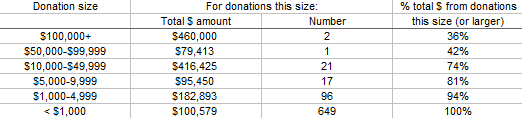
The tables below show GiveWell’s 2010 money moved by (a) organization and (b) size of donation. They show a total of just over $1.5 million, the vast majority of which went to our top-rated charity, VillageReach.
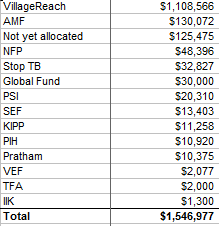
Note: these figures do not match up exactly to the above total money moved figures because this table does not include donations made directly to our recommended charities that the charities informed us about and for which we do not know the individual donation sizes.
Donations through the website
While the aggregate money moved figure (which includes all money donated to charities due to GiveWell’s recommendation) is ultimately the more meaningful measure of GiveWell’s impact, we believe that donations by website visitors whom GiveWell staff don’t know personally is a more meaningful measure of GiveWell’s progress as these donations represent (a) use of the GiveWell tool as we ultimately envision it (i.e., retail donors coming to the site and using it to give) and (b) are less susceptible to large, one-off circumstances that lead to large variations in the aggregate money moved figure.
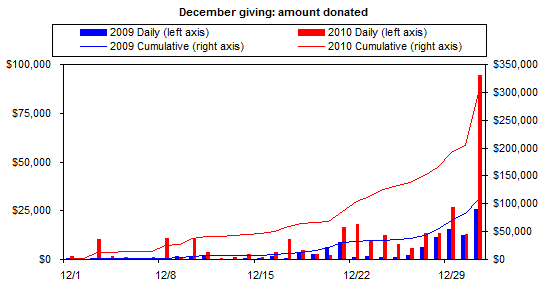
The following charts show monthly donations through the website, for 2008-2010. (We include January 2011 data.) We’ve attempted to strip out donors we have had personal contact with (we aren’t able to see the source of all donations, so some could be included, although we were able to see the source of – and thus strip out – the bulk of donations for which this applies).
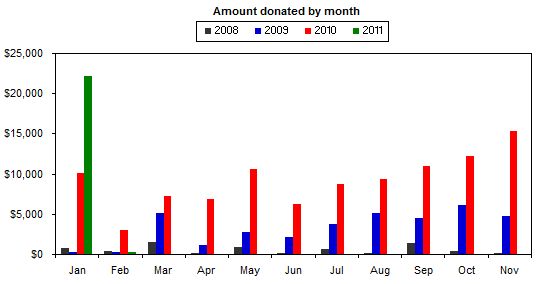
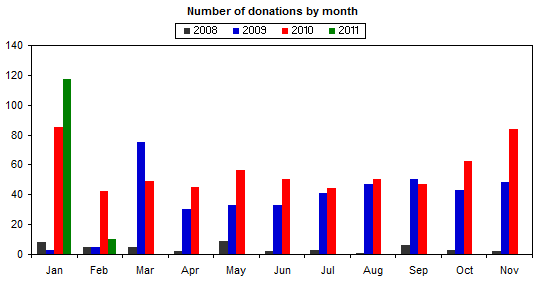
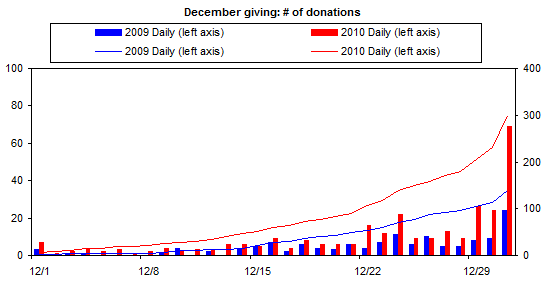
The following two charts show data just for December, the month in which we see significantly more donation activity.
Comparison to Charity Navigator and GuideStar
As shown above, donations through our website were substantially higher in 2010 than in 2009. We used the public Network for Good tickers for Charity Navigator and GuideStar to compare our growth (and level) to theirs, to see how much of our growth can be attributed to GiveWell’s improvement in particular vs. more interest in online charity evaluators / online giving in general. (We have confirmed that we are looking at the right data with Charity Navigator; we are still waiting for confirmation from GuideStar, but the numbers we got from this ticker match almost exactly with the independent numbers they sent us for 2010.)
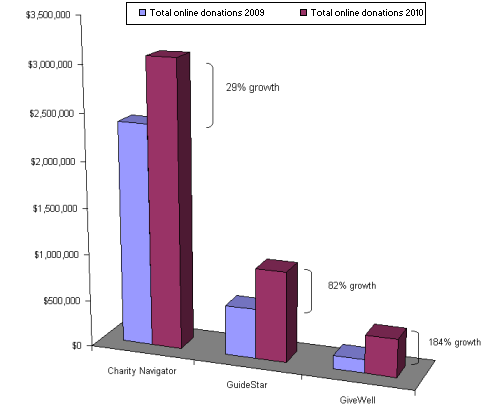
It’s also worth noting the levels of (not just changes in) these figures. Though Charity Navigator had about 30x as many donations as GiveWell in 2010, and GuideStar about 9x as many, the average donation for GiveWell was over 4x higher (~$450 for GiveWell; closer to $100 for each of the other two). Net result: the total online donations for GiveWell were about 13% of those for Charity Navigator and 42% of those for GuideStar.
There are many possible interpretations of these numbers. One could argue that GuideStar’s and Charity Navigator’s numbers understate the actual impact, more so than they do for GiveWell, because people are more likely to use those sites as only one step in the process and end up giving via the charity’s own website. One could also argue the reverse: available information implies that more people are using GiveWell’s research to make large donations, and people often prefer to give these donations using donor-advised funds and checks rather than online.
One thing we do feel is the case, however, is that a donation given through GiveWell likely represents a much bigger impact – in terms of changing a donor’s actions from what they would have done otherwise – than a donation given through GuideStar or Charity Navigator. GiveWell recommends only 10 charities, while Charity Navigator lists over 1600 charities with its highest four-star rating and GuideStar allows donors to give to just about any charity they’d like. GiveWell is designed to make a strong recommendation of where to give; the others are designed to help people make one final check on the charity they had already planned on supporting. So while donations through the website remain lower for GiveWell than for Charity Navigator and GuideStar, they are now in the same ballpark, and there is an argument that the overall impact of GiveWell is at least as high.
What changed between 2009 and 2010?
- Six-figure gifts: two individual donors, both of whom have been following GiveWell for a long time, each made six figure gifts in 2010. The two donations totaled around $460,000. These donors had both refrained from large gifts to recommended charities in the past; in 2009, their giving to our top charities totaled $10,000. On the other hand, we did not repeat the 2009 economic empowerment grant (funded by an anonymous donor). So we gained a net of about $200,000 on six-figure gifts.
- New donors: $387,585 came from donors who hadn’t given before, while we lost $118,793 via donors who had given in 2009 and did not repeat in 2010. So the net from donor turnover was about +$270,000. This figure is about the same size as, though conceptually different from, the increase we saw in donations through the website.
We break down the 2009-2010 changes in more detail at the bottom of this post.
Web traffic
Our web traffic roughly doubled in 2010 vs. 2009. The following shows web traffic by source.
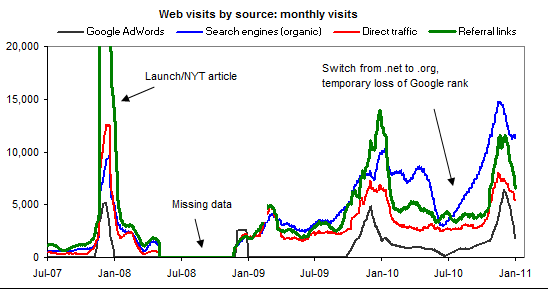
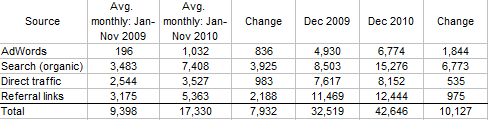
Two notes:
- The largest driver of growth in web traffic in 2010 was increased organic (i.e., non-AdWords) search traffic.
- The charts include data from January 2011 and the recent dips are a function of normal seasonality — i.e., we have more traffic during December’s giving season.
Money moved vs operating expenses over time
The following chart shows GiveWell’s total money moved each year (2007-2010) relative to our operating expenses. A major question for GiveWell is whether the value of our research is worth the cost of producing it. Money moved has continued to grow significantly relative to operating expenses.
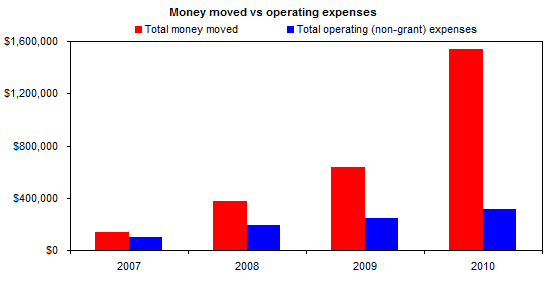
Note that the above chart reports lower 2009 and higher 2008 money moved figures than our 2010-vs-2009 comparison above and our previous report. This is due to the way we reported data in 2008 and 2009. We spent a significant portion of 2008 soliciting funds for organizations we intended to recommend in the future. We ultimately made these recommendations in mid-2009. The funds were actually donated in 2009 but were committed in 2008. We believe that counting the funds when they were committed provides the most accurate picture of changes in GiveWell’s influence relative to operating expenses over time (though counting the funds when they were given makes it easier for us to track what changed between 2009 and 2010).
What we count as “money moved”:
- Donations made to top charities directly through our website. Though these donations go directly to top charities, we are able to track them and verify that they went through our website. (Example: VillageReach donate page)
- Donations that our recommended charities report back to us as being attributable to GiveWell (we have a high standard for this – we count only cases where (a) the donor explicitly stated that their donation was on the strength of GiveWell’s recommendation or (b) the donor gave to Nurse-Family Partnership and stated that they heard about it from a Nicholas Kristof column; Mr. Kristof has informed us that he included NFP in the column on our recommendation).
- Donations that donors report to us (informally or using our donation report form) as donations that they made on the strength of our recommendation. We cross-reference our data with recommended charities’ data, when necessary, to eliminate double-counting.
- Donations made directly to GiveWell and earmarked for re-granting. We count donations made and restricted in year X, and then granted in year Y, as “money moved” for year X, not year Y.
More details on what changed between 2009 and 2010:
- Two individual donors, both of whom have been following GiveWell for a long time, each made six figure gifts in 2010. The two donations totaled around $460,000. These donors had both refrained from large gifts to recommended charities in the past; in 2009, their giving to our top charities totaled $10,000. On the other hand, we did not repeat the 2009 economic empowerment grant (funded by an anonymous donor). So we gained a net of about $200,000 on six-figure gifts.
- $387,585 came from donors who hadn’t given before, while we lost $118,793 via donors who had given in 2009 and did not repeat in 2010. So the net from donor turnover was about +$270,000. Some additional context on these numbers:
- 13 new large donors, giving between $8-30k each, accounted for $163,449 of the $387,585 in gains. The rest came from nearly 500 smaller donors ($6k and under).
- Of the $387,585 in new donations, we can (using a combination of web analytics and optional “Where did you hear about us?” surveys) attribute $56,672 to organic search (i.e., people searching for things like “best charities” – not for GiveWell itself – and not including Google AdWords); $30,903 to the outreach of Peter Singer; $19,691 to “word of mouth”; and $18,517 to Google AdWords.
- We do not know the source of the other ~$195k in new donations. We can guess at what the distribution looks like using our survey data. Of the 2010 users who responded to surveys about where they heard about us, 13% found us via search, 23% found us through media, 25% found us through word of mouth or links from other sites, and 38% found us through the outreach of Peter Singer.
- Of the ~$118k in lost donations, $73k can be attributed to donors who simply gave early in 2011 instead of late in 2010. The remaining ~$45k comes from donations of $5,000 and under, and the fact that we lost this many small donors is a source of some concern.
- Donors who gave in both 2009 and 2010 gave less in 2010: $411,787 vs. $354,900 for a net loss of about $57,000. Three very large donors lowered their donations by a total of over $100k, for reasons that we believe to be related to financial circumstances, while another donor increased his by $30k; the rest of the changes netted out to a slight gain.
- Donations to GiveWell, earmarked for regranting, fell by a net of $38,326. About $46,000 of this loss represented donors who switched over to giving to our top charities, or to GiveWell unrestricted, instead of giving to GiveWell restricted. There was another ~$29,000 in losses, $9,000 of which came from one donor and the rest of which came largely from people who had donated immediately after our 2007 launch and not returned, offset by ~$36,000 in gains, ~$34,000 of which came from 3 donors.
- We had $238,988 in donations that we weren’t able to attribute to specific donors (donations that went through Network for Good plus donations reported to us by charities as coming on the strength of GiveWell’s recommendation), up from $56,200 in 2010, for a net gain of about $180,000 in this “mystery” category.
Comments
Congratulations on a very promising year
Elie,
Do you estimate the impact of your “money moved?” i.e., what the effective value of the movement is. Perhaps, how much money is donated, that wouldn’t otherwise have been donated (at least at this time). And for donations that were relocated, how much more efficient it is in the new location than the old one. (Or perhaps it’s better to just treat all as an increase in efficiency, on the expectation that any donations not made today, would eventually be made in the future, just not necessarily to proven-effective charities.)
If so, how do you estimate it, and what do you estimate it to be?
If not, how do you evaluate what a reasonable long-term goal is for overhead costs of Givewell. (I think another post indicated a goal of moving 9x Givewell operating costs.)
J.S., see the comments over here for related discussion:
https://blog.givewell.org/2011/02/14/givewells-plan-for-2011-top-level-priorities/
I’m not sure GiveWell’s impact is so much in getting donors to give MORE than they otherwise might have, but rather, to hopefully give more EFFECTIVELY than they otherwise would have.
So the key question is whether the bump in effectiveness due to GiveWell research is greater than the cost of running GiveWell.
It’s a good question to ask, albeit perhaps a bit premature (GiveWell still seems to be in a stage of relatively rapid growth in readership and impact, and costs are apparently going to scale up some, too). Personally, I think it’s quite reasonable to expect that money given to top GiveWell recommended charities will have it’s effectiveness boosted by more than enough to offset GiveWell’s costs, assuming GiveWell hits the targets outlined in these planning posts (and perhaps even at less ambitious targets).
Disclosure: I’m a relatively long-time advisor to the GiveWell guys, so I’m far from neutral. Take it for what it’s worth…
Phil, thanks for the pointer, but the trouble with the argument you make in that other comment thread is that it’s a handwaving argument, based on the belief (but not evidence) of a substantial efficiency/impact advantage of Givewell investments vs. wherever the money would have gone, otherwise.
Now, perhaps this is something that we really can only take on faith at this point in time, due to relative lack of transparency on the part of most charities. And I’d even agree it seems pretty likely that the kind of evidence-based impact Givewell identifies in its recommended charities is sufficient to overcome a ~11% level of overhead, pretty easily.
But it certainly doesn’t feel ideal for an effort focused on identifying evidence-based impact to be only able to assume that its own efforts produce sufficient benefit to justify its overhead. Hence my question. I was interested in hearing what Holden and Elie have concluded regarding this issue.
And note, this question is probably an important one with respect to Givewell’s fundraising efforts for itself. i.e., one would expect that a donor considering a donation to cover Givewell’s research costs would consider the effective leverage of that donation as an investment to be highly relevant.
For some initial period, donors may be especially willing to take it on faith that the results are effective. But at some point, one would think donors to this kind of effort would want to understand more substantively what value their donation achieves. (And if one can show a very high leverage, it would presumably motivate donations.)
What’s more, to the degree Givewell ends up with excess unrestricted funds in the future, and needs to choose between expansion of their research efforts and making grants directly to charities that they research and find to be highly effective, they need to have a basis to decide which is the more efficient and impactful approach.
So personally, even if this is something that’s not presently answerable today, I’d like to understand the degree to which Givewell perceives that they will be able to answer such, in the (hopefully not-too-distant) future.
For what it’s worth, Givewell’s 11% overhead ratio compares favorably to the cost of paid charity advisors like Geneva Global (which charges 15%) or to the 9.5% fundraising overhead of charities themselves.
J. S., this is indeed something we think about. There are two issues here:
Re #1, this is not something we’ve tried to track in the past though we’ve begun to track it this year. In January, we emailed all new donors who gave more than $10,000 or more to our recommended charities to ask them where they had previously given. Note that donations of $10,000 or higher accounted for 74% of our total money moved. We only emailed new donors because we already had some information about donors whom we had met in previous years.
Please keep in mind that the numbers below are not exact. They’re an estimate of where donors would have otherwise given. We estimate that:
#2 is much harder to answer. Even for charities that we think are better-than-average, we don’t have a concrete sense of cost-effectiveness. For instance, we rate The Carter Center “Notable” but have discussed in our review and on our blog why we struggle to come to an aggregate $ per life impacted for them. Alternatively, there are organizations working on programs we think are important (e.g., Deworm the World or the Schistosomiasis Control Initiative), but we’re still struggling to understand their value added and the likely impact of the marginal donation.
At some point I believe we will do some basic analysis of how cost-effective one might expect “average” charities to be, based on aggregate costs and results of international aid. However, we expect our info on this topic to be very limited as long as most charities remain as opaque as they are.
Overall, given the lack of attention donors pay to results, we think there is high value in funds publicly flowing to organizations that stand out for their impact. Charities will respond to the monetary incentive provided by donors to do better work and demonstrate that that work is effective. We believe that ultimately our work will have an impact not only via the money that flows through our site but by helping to create a world in which charities are rewarded for effectiveness in improving lives.
Ian, I think the comparison to other entities is useful to some degree, particularly in the absence of absolute info.
Elie, thanks for providing the additional information that you do have.
Elie, regarding:
The amount of money moved seems to be a key variable here. I’m not sure how much change one can hope to see from money moved on the order of $4-5 million/year (GiveWell’s stated steady state target at the moment). Not that I’m not expressing skepticism; the situation is just very murky in my mind. A couple of hypotheticals:
1. Consider a large charity receiving ~ $200 million in donations a year. How would such a charity respond to the possibility of a cash flow from GiveWell donors? It seems very unlikely that they’d be willing to restructure their whole organization in exchange for a possible increase of %2-2.5 in revenue unless the possibility served as a straw that broke the camel’s back in the event that they were were already motivated to make their programs more effective and just needed a final push.
Maybe such an organization would be willing to create a small highly effectiveness oriented subprogram to serve GiveWell-type donors. This gets into the issues mentioned mentioned in the “Project Funding” point in Holden’s GiveWell’s plan for 2011: specifics of research posting.
2. Unproven programs do not meet GiveWell’s criteria and so the $4-5 million from donors would not directly encourage people to start new programs designed to help people as much as possible. Now, there may be indirect effects on account of charities knowing that there might be some money out there to help them if they can prove their programs effective, helping them through the “valley of death” that Holden refers to in After “Extraordinary and Unorthodox” comes the Valley of Death.
But the slim odds that Holden gives for the success of Small, unproven charities points toward the probability of such a charity succeeding in having a positive impact is small, — this pushes away from being motivated by the possibility of getting some extra funding by showing positive impact.
The counter-considerations that I’ve given here are by no means a holistic argument against the idea that GiveWell can have some positive effect on incentives for charities while moving $4-5 million a year, but the effect might be smaller than one would hope. I would expect that impact on incentives for charities as a function of money moved to be concave up (scaling of power with influence).
I should also note that the givewell overhead number does not take into account charities’ own costs in receiving Givewell-directed money, so a direct comparison between the Givewell number and the average charity fundraising overhead may not be entirely fair. This would include costs responding to Givewell inquiries as well as costs interacting directly with Givewell donors who do their own do diligence, such as Dario, Jason, and (of course) me. I would guess that I ran up several hundred dollars’ worth of fundraising costs (or perhaps fundraising opportunity costs) in the course of my 2009 donation, mostly in the form of staff time.
Of course, there are other reasons to question the fundraising overhead figure on its own (accounting) merits, such as when fundraising and costs are mixed together.
Jonah, I think you do underestimate the incentive effects for a couple of reasons: (a) unrestricted funding is particularly valuable to charities; (b) “money moved” counts only the donations we can attribute fully to our research. There is also the intangible value of being able to claim distinction from GiveWell (and most charities seem to value third-party marks of distinction very highly). In addition, there is an intellectual argument for doing things “our way” – an argument that I think would fall in deaf ears if it were accompanied by no fundraising benefits, but that can be very powerful when accompanied by benefits that are both tangible and intangible.
A GiveWell moving $5-6 million a year would probably not cause many charities to redesign their entire operations from scratch around our criteria, but it could change a lot of decisions about transparency, evaluation, etc. on the margin. GiveWell may also affect the way other funders evaluate organizations, which would magnify the effects greatly. I think we are already seeing some of these effects, and we may be discussing the details in a future post.
Ian, every dollar spent causes ripple effects in how resources are consumed. When you evaluate a typical charity on costs vs. impact, you don’t include things like the cost of funders’ time spent considering the charity for funding. I think the frame of reference we’ve been using to discuss GiveWell’s expenses vs. impact is a good one.
Holden, thanks for the response, good points, especially about intangible value. Regarding:
I look forward to hearing more when the time is right.
Comments are closed.