In addition to evaluations of other charities, GiveWell publishes substantial evaluation of itself, from the quality of its research to its impact on donations. We publish quarterly updates regarding two key metrics: (a) donations to top charities and (b) web traffic.
The table and chart below present basic information about our growth in money moved and web traffic in the first half of 2013 (note 1).

Growth in money moved accelerated in the second quarter. At the end of the first quarter, donations from donors giving less than $5,000 per year were up 45% year over year (note 2). This figure rose to 100% by the end of the second quarter. This increase is likely due mostly to media attention in the second quarter, including a TED Talk by Peter Singer, a piece on Washington Post’s Wonkblog and subsequent debate on various blogs, and a New York Times article.
A caveat to the above is that it is based solely on small donors. In the past we’ve seen that growth in small donors earlier in the year provides an indication of overall growth at the end of the year, but because a significant proportion of our money moved comes from a relatively small set of large donors, we don’t place significant weight on this projection.
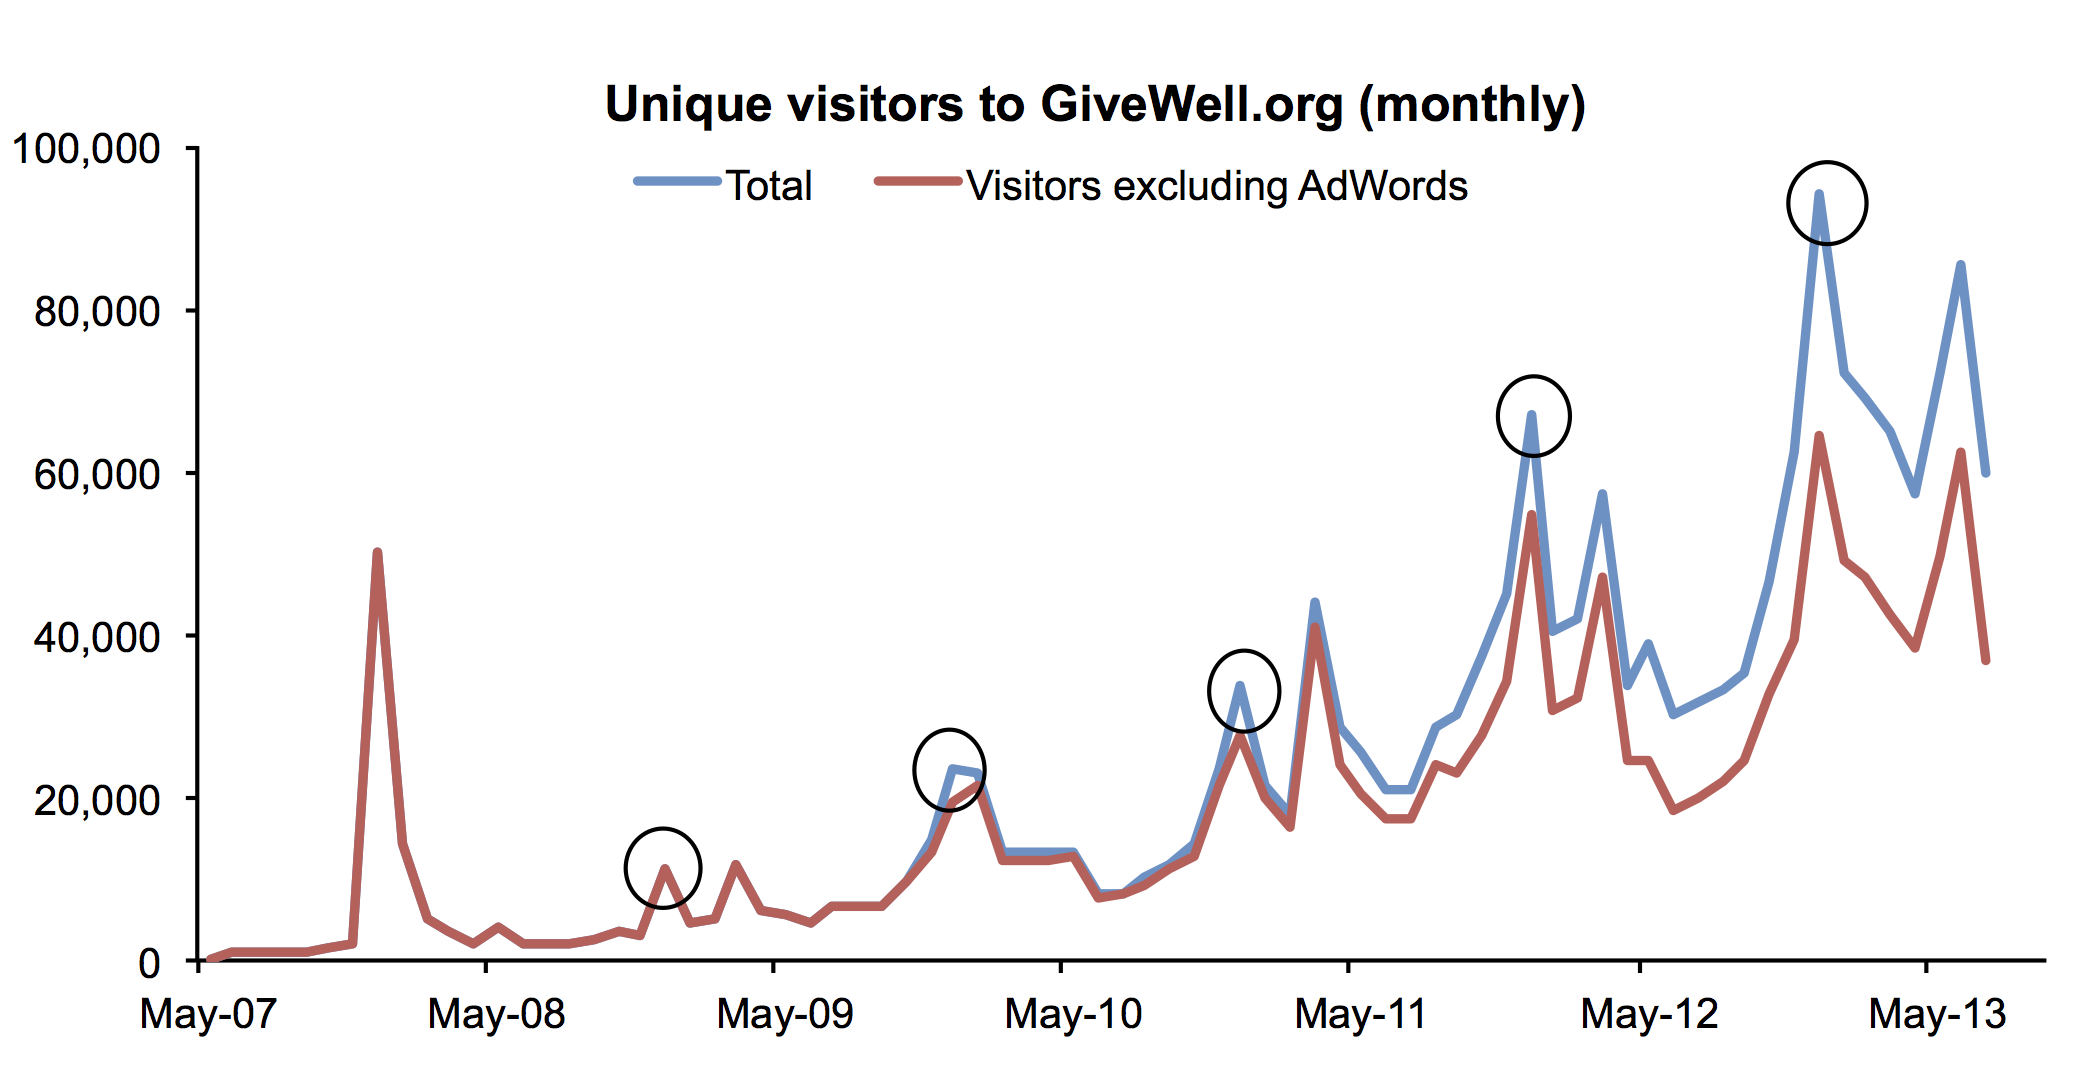
Website traffic tends to peak in December of each year (circled in the chart below). Growth in web traffic has generally remained strong in 2013. So far in 2013, there have been 408,782 monthly unique visitors (calculated as the sum of unique visitors in each month) to the website, compared with 233,550 at this time in 2012, or 75% annual growth.
Note 1: Since our 2012 annual metrics report we have shifted to a reporting year that starts on February 1, rather than January 1, in order to better capture year-on-year growth in the peak giving months of December and January. Therefore metrics for the first half of 2013 reported here are for February through July.
Note 2: The majority of the funds GiveWell moves come from a relatively small number of donors giving larger gifts. These larger donors tend to give in December, and we have found that, in past years, growth in donations from smaller donors throughout the year has provided a reasonable estimate of the growth from the larger donors by the end of the year.
In total, GiveWell donors have directed $1,433,139 to our top charities this year, compared with $1,018,625 at this point in 2012. For the reason described, we don’t find this number to be particularly meaningful at this time of year.
Comments
Does GiveWell keep records of its website traffic from different countries?
Joseph – yes, we use common web analytics software that records such info.
Comments are closed.