
My last post explains why I largely trust the most famous school-based deworming experiment, in particular the report in Worms at Work about its long-term benefits. That post also gives background on the deworming debate, so please read it first. In this post, I’ll talk about the problem of generalization. If deworming in southern Busia County, Kenya, in the late 1990s permanently improved the lives of some children, what does that tell us about the impact of deworming programs today, from sub-Saharan Africa to South Asia? How safely can we generalize from this study?
I’ll take up three specific challenges to its generalizability:
- That a larger evidence base appears to show little short-term benefit from mass deworming—and if it doesn’t help much in the short run, how can it make a big difference in the long run?
- That where mass deworming is done today, typically fewer children need treatment than in the Busia experiment.
- That impact heterogeneity within the Busia sample—the same treatment bringing different results for different children—might undercut expectations of benefits beyond. For example, if examination of the Busia data revealed long-term gains only among children with schistosomiasis, that would devalue treatment for the other three parasites tracked.
In my view, none of these specific challenges knocks Worms at Work off its GiveWell-constructed pedestal. GiveWell’s approach to evaluating mass deworming charities starts with the long-term earnings impacts estimated in Worms at Work. Then it discounts by roughly a factor of ten for lower worm burdens in other places, and by another factor of ten out of more subjective conservatism. As in the previous post, I conclude that the GiveWell approach is reasonable.
But if I parry specific criticisms, I don’t dispel a more general one. Ideally, we wouldn’t be relying on just one study to judge a cause, no matter how compelling the study or how conservative our extrapolation therefrom. Nonprofits and governments are spending tens of millions per year on mass deworming. More research on whether and where the intervention is especially beneficial would cost only a small fraction of all those deworming campaigns, yet potentially multiply their value.
Unfortunately, the benefits that dominate our cost-effectiveness calculations manifest over the long run, as treated children grow up. And long-term research tends to take a long time. So I close by suggesting two strategies that might improve our knowledge more quickly.
Here are Stata files for the quantitative assertions and graphs presented below.
Evidence suggests short-term benefits are modest
Researchers have performed several systematic reviews of the evidence on the impacts of deworming treatment. In my research, I focused on three. Two come from institutions dedicated to producing such surveys, and find that mass deworming brings little benefit, most emphatically in the short run. But the third comes to a more optimistic answer.
The three are:
- The Cochrane review of 2015, which covers 45 trials of the drug albendazole for soil-transmitted worms (geohelminths). It concludes: “Treating children known to have worm infection may have some nutritional benefits for the individual. However, in mass treatment of all children in endemic areas, there is now substantial evidence that this does not improve average nutritional status, haemoglobin, cognition, school performance, or survival.”
- The Campbell review of 2016, which extends to 56 randomized short-term studies, in part by adding trials of praziquantel for water-transmitted schistosomiasis. “Mass deworming for soil-transmitted helminths …had little effect. For schistosomiasis, mass deworming might be effective for weight but is probably ineffective for height, cognition, and attendance.”
- The working paper by Kevin Croke, Eric Hsu, and authors of Worms at Work. The paper looks at impacts only on weight, as an indicator of recent nutrition. (Weight responds more quickly to nutrition than height.) While the paper lacks the elaborate, formal protocols of the Cochrane and Campbell reviews, it adds value in extracting more information from available studies in order to sharpen the impact estimates. It finds: “The average effect on child weight is 0.134 kg.”
Before confronting the contradiction between the first two reviews and the third, I will show you a style of reasoning in all of them. The figure below constitutes part of the Campbell review’s analysis of the impact of mass administration of albendazole (for soil-transmitted worms) on children’s weight (adapted from Figure 6 in the initial version):
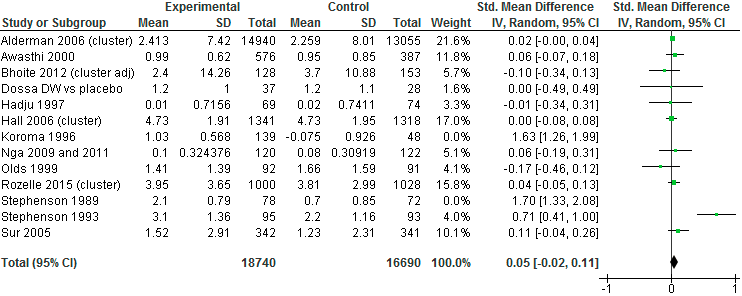
Each row distills results from one experiment; the “Total” row at the bottom draws the results together. The first row, for instance, is read as follows. During a randomized trial in Uganda run by Harold Alderman and coauthors, the 14,940 children in the treatment group gained an average 2.413 kilograms while the 13,055 control kids gained 2.259 kg, for a difference in favor of the treatment group of 0.154 kg. For comparability with other studies, which report progress on weight in other ways, the difference is then re-expressed as 0.02 standard deviations, where a standard deviation is computed as a sort of average of the 7.42 and 8.01 kg figures shown for the treatment and control groups. The 95% confidence range surrounding the estimate of 0.02 is written as [–0.00, 0.04] and is in principle graphed as a horizontal black line to the right, but is too short to show up. Because of its large sample, the Alderman study receives more weight (in the statistical sense) than any other in the figure, at 21.6% of the overall number. The relatively large green square in the upper right signifies this influence.
In the lower-right of the figure, the bolded numbers and the black diamond present the meta-analytical bottom line: across these 13 trials, mass deworming increased weight by an average 0.05 standard deviations. The aggregate 95% confidence interval stretches from –0.02 to 0.11, just bracketing zero. The final version of the Campbell report expresses the result in physical units: an average gain of 0.09 kg, with a 95% confidence interval stretching from –0.09 kg to +0.28 kg. And so it concludes: “Mass deworming for soil-transmitted helminths with albendazole twice per year compared with controls probably leads to little to no improvement in weight over a period of about 12 months.”
Applying similar methods to a similar pool of studies, the Cochrane review (Analysis 4.1) produces similar numbers: an average weight gain of 0.08 kg, with a 95% confidence interval of –0.11 to 0.27. This it expresses as “For weight, overall there was no evidence of an effect.”
But Croke et al. incorporate more studies, as well as more data from the available studies, and obtain an average weight gain of 0.134 kg (95% confidence interval: 0.03 to 0.24), which they take as evidence of impact.
How do we reconcile the contradiction between Croke et al. and the other two? We don’t, for no reconciliation is needed, as is made obvious by this depiction of the three estimates of the impact of mass treatment for soil-transmitted worms on children’s weight:
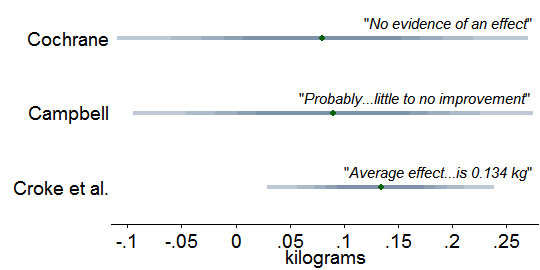
Each band depicts one of the confidence intervals I just cited. The varied shading reminds us that within each band, probability is highest near the center. The bands greatly overlap, meaning that the three reviews hardly disagree. Switching from graphs to numerical calculations, I find that the Cochrane results reject the central Croke et al. estimate of 0.134 kg at p = 0.58 (two-tailed Z-test), which is to say, they do not reject with any strength. For Croke et al. vs. Campbell, p = 0.64. So the Croke et al. estimate does not contradict the others; it is merely more precise. The three reviews are best seen as converging to a central impact estimate of about 0.1 kg of weight gain. Certainly 0.1 kg fits the evidence better than 0.0 kg.
If wide confidence intervals in the Cochrane and Campbell reviews are obscuring real impact on weight, perhaps the same is happening with other outcomes, including height, hemoglobin, cognition, and mortality. Discouragingly, when I scan the Cochrane review’s “Summary of findings for the main comparison” and Campbell’s corresponding tables, confidence intervals for outcomes other than weight look more firmly centered on zero. That in turn raises the worry that by looking only at weight, Croke et al. make a selective case on behalf of deworming.[1]
On the other hand, when we shift our attention from trials of mass deworming to trials restricted to children known to be infected—which have more power to detect impacts—it becomes clear that the boost to weight is not a one-off. The Cochrane review estimates that targeting treatment at kids with soil-transmitted worms increased weight by 0.75 kilograms, height by 0.25 centimeters, mid-upper arm circumference by 0.49 centimeters, and triceps skin fold thickness by 1.34 millimeters, all significant at p = 0.05. Treatment did not, however, increase hemoglobin (Cochrane review, “Data and Analyses,” Comparison 1).
In this light, the simplest theory that is compatible with the evidence arrayed so far is that deworming does improve nutrition in infected children while leaving uninfected children unaffected; and that available studies of mass deworming tend to lack the statistical power to detect the diluted benefits of mass deworming, even when combined in a meta-analysis. The compatibility of that theory with the evidence, by the way, exposes a logical fallacy in the Cochrane authors’ conclusion that “there is now substantial evidence” that mass treatment has zero effect on the outcomes of interest. Lack of compelling evidence is not compelling evidence of lack.
Yet the Cochrane authors might be right in spirit. If the benefit of mass deworming is almost too small to detect, it might be almost too small to matter. Return to the case of weight: is 0.1 kg a lot? Croke et al. contend that it is. They point out that “only between 2 and 16 percent of the population experience moderate to severe intensity infections in the studies in our sample that report this information,” so their central estimate of 0.134 could indicate, say, a tenth of children gaining 1.34 kg (3 pounds). This would cohere with Cochrane’s finding of an average 0.75 kilogram gain in trials that targeted infected children. In a separate line of argument, Croke et al. calculate that even at 0.134, deworming raises children’s weight more cheaply than school feeding programs do.
But neither defense gets at what matters most for GiveWell, which is whether small short-term benefits make big long-term earnings gains implausible. Is 0.134 kg in weight gain compatible with 15% income gain 10 years later reported in Worms at Work?
More so than it may at first appear, once we take account of two discrepancies embedded in that comparison. First, more kids had worms in Busia. I calculate that 27% of children in the Worms sample had moderate or serious infections, going by World Health Organization (WHO) guidelines, which can be viewed conservatively as double the 2–16% Croke et al. cite as average for the kids behind that 0.134 kg number.[2] So in a Worms-like setting, we should expect twice as many children to have benefited, doubling the average weight gain from 0.134 to 0.268 kg. Second, at 13.25 years, the Worms children were far older than most of the children in the studies surveyed by Croke et al. Subjects averaged 9 months of age in the Awasthi 2001 study, 12–18 months in Joseph 2015, 24 months in Ndibazza 2012, 36 months in Willett 1979, and 2–5 years in Sur 2005. 0.268 kg means more for such small people. As Croke et al. point out, an additional 0.268 kg nearly suffices to lift a toddler from the 25th to the 50th percentile for weight gain between months 18 and 24 of life (girls, boys).
In sum, the statistical consensus on short-term impacts on nutritional status does not render implausible the long-term benefits reported out of Busia. The verdict of Garner, Taylor-Robinson, and Sachdev—“no effect for the main biomedical outcomes…, making the broader societal benefits on economic development barely credible”—overreaches.
In many places, fewer kids have worms than in Busia in 1998–99
If we accept the long-term impact estimates from Worms at Work, we can still question whether those results carry over to other settings. This is precisely why GiveWell deflates the earnings impact by two orders of magnitude in estimating the cost-effectiveness of deworming charities. One of those orders of magnitude arises from the fact that school-age children in Busia carried especially heavy parasite loads. Where loads are lighter, mass deworming will probably do less good.
GiveWell’s cost-effectiveness spreadsheet does adjust for difference in worm loads between Worms and places where recommended charities support mass deworming today. So I spent some time scrutinizing this discount—more precisely, the discounts of individual GiveWell staffers. I worried in particular that the ways we measure worm loads could lead my colleagues to overestimate the need for and benefit of mass deworming.
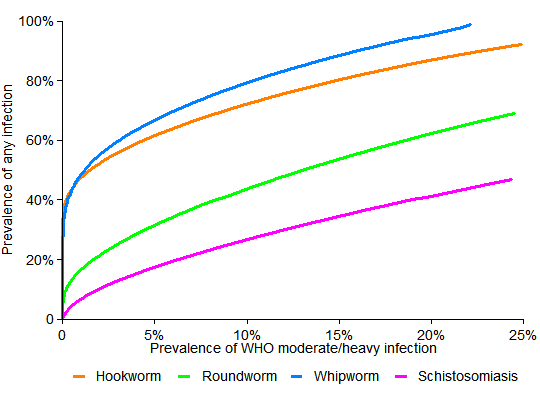
As a starting point, I selected a few data points from one of the metrics GiveWell has gathered, the fraction of kids who test positive for worms. This table shows the prevalence of worm infection, by type, in Busia, 1998–99, before treatment, and in program areas of two GiveWell-recommended charities:
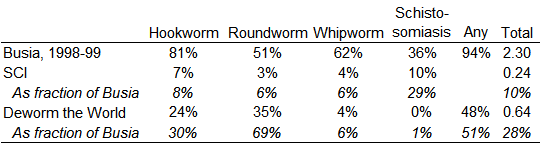
The first row, computed from the public Worms data set, reports that before receiving any treatment from the experiment, 81% of tested children in Busia were positive for hookworm, 51% for roundworm, 62% for whipworm, and 36% for schistosomiasis. 94% tested positive for at least one of those parasites. On average, each child carried 2.3 distinct types of worm. Then, from the GiveWell cost-effectiveness spreadsheet, come corresponding numbers for areas served by programs linked to the Schistosomiasis Control Initiative (SCI) and Deworm the World. Though approximate, the numbers suffice to demonstrate that far fewer children served by these charities have worms than in the Worms experiment. For example, the hookworm rate for Deworm the World is estimated at 24%, which is 30% of the rate of Busia in 1998–99. Facing less need, we should expect these charities’ activities to do less good than is found in Worms at Work.
But that comparison would misrepresent the value of deworming today if the proportion of serious infections is even lower today relative to Busia. To get at the possibility, I made a second table for the other indicator available to GiveWell, which is the intensity of infection, measured in eggs per gram of stool:
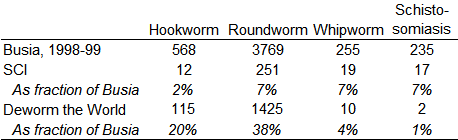
Indeed, this comparison widens the apparent gap between Busia of 1998–99 and charities of today. For example, hookworm prevalence in Deworm the World service areas was 30% of the Busia rate (24 vs. 81 out of every 100 of kids), while intensity was only 20% (115 vs. 568 eggs/gram).
After viewing these sorts of numbers, the median GiveWell staffer multiplies the Worms at Work impact estimate by 14%—that is, divides it by seven. In aggregate, I think my coworkers blend the discounts implied by the prevalence and intensity perspectives.[3]
To determine the best discount, we’d need to know precisely what characterized the children within the Worms experiment who most benefited over the long term—perhaps lower weight, or greater infection with a particular parasite species. As I will discuss below, such insight is easier imagined than attained. If we had it, we would then need to know the number of children in today’s deworming program areas with similar profiles. Obtaining that data could be a tall order in itself.
To think more systematically about how to discount for differences in worm loads, within the limits of the evidence, I looked to some recent research that models how deworming affects parasite populations. Nathan Lo and Jason Andrews led the work (2015, 2016). With Lo’s help, I estimated how the prevalence of serious infection varies with the two indicators at GiveWell’s fingertips.[4]
For my purposes, the approach introduces two key ideas. First, data gathered from many locales shows how, for each worm type, the average intensity of infection tends to rise as prevalence increases. Not surprisingly, where worm infection is more common, average severity tends to be higher too—and Lo and colleagues estimate how much so. Second is the use a particular mathematical family of curves to represent the distribution of children by intensity levels—how many have no infection, how many have 1-100 eggs/gram, how many are above 100 eggs/gram, etc. (The family, the negative binomial, is an accepted model for the prevalence of infectious diseases.) If we know two things about the pattern of infection, such as the fraction of kids who have it and their average intensity, we can mathematically identify a unique member of this family of distributions. And once a member is chosen, we can estimate the share of children with, for example, hookworm infections exceeding 2,000 eggs/gram, which is the WHO’s suggested minimum for moderate or heavy infection.
The next two graphs examine how, under these modeling assumptions, the fraction of children with moderate/heavy infections varies in tandem with the two indicators at GiveWell’s disposal, which are prevalence of infection and average infection intensity:
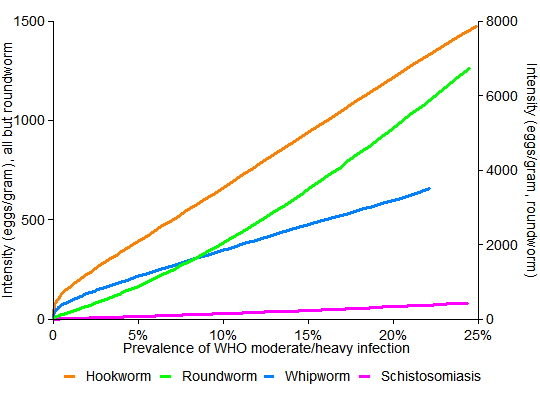
The important thing to notice is that the curves are much curvier in the first graph. There, for example, as the orange hookworm curve descends, it converges to the left edge just below 40%. This suggests that if a community has half as many kids with hookworm as in Busia—40% instead of about 80%—then it could have far less than half as many kids with serious infections—indeed, almost none. But the straighter lines in the second graph mean that a 50% drop in intensity (eggs/gram) corresponds to a 50% drop in the number of children with serious disease.
While we don’t know exactly what defines a serious infection, in the sense of offering hope that treatment could permanently lift children’s trajectories, these simulations imply that it is reasonable for GiveWell to extrapolate from Worms at Work on the basis of intensity (eggs/gram).
Returning to the intensity table above, I find that the Deworm the World egg counts, by worm type, average 16% of those in Busia. For the Schistosomiasis Control Initiative, the average ratio is 7% (and is 6% just for SCI’s namesake disease). These numbers say—as far as this sort of analysis can take us—that GiveWell’s 14% discounts are about right for Deworm the World, and perhaps ought to be halved for SCI. Halving is not as big a change as it may seem; GiveWell has no illusions about the precision of its estimates, and performs them only to gauge the order of magnitude of expected impact.
Impact heterogeneity in the Worms experiment
Having confronted two challenges to the generalizability of Worms at Work—that short-term non-impacts make long-term impacts implausible, and that worm loads are lower in most places today than they were in Busia in 1998–99—I turned to one more. Might there be patterns within the Worms at Works data that would douse hopes for impact beyond? For example, if only children with schistosomiasis experienced those big benefits, that would call into question the value of treating geohelminths (hookworm, roundworm, whipworm).
Returning to the Worms at Work data, I searched for—and perhaps found—signs of heterogeneity in impact. I gained two insights thereby. The first, as it happens, is more evidence that is easier-explained if we assume that the Worms experiment largely worked, the theme of the last post. The second is a keener sense that there is no such thing as the “the” impact of an intervention, since it varies by person, time, and place. That heightened my nervousness about extrapolating from a single study. Beyond that general concern, I did not find specific evidence that would cast grave doubt on whole deworming campaigns.
My hunt for heterogeneity went through two phases. In the first, motivated by a particular theory, I brought a narrow set of hypotheses to the data. In the second, I threw about 20 hypotheses at the data and watched what stuck: Did impact vary by sex or age? By proximity to Lake Victoria, where live the snails that carry Schistosoma mansoni? As statisticians put it, I mined the data. The problem with that is that since I tested about 20 hypotheses, I should expect about one to manifest as statistically significant just by chance (at p = 0.05). So the pattern I unearthed in the second phase should perhaps not be viewed as proof of anything, but as the basis for a hypothesis that, for a proper test, requires fresh data from another setting.
Introducing elevation
My search began this way. In my previous post, I entertained an alternative theory for Owen Ozier‘s finding that deworming indirectly benefited babies born right around the time of the original Worms experiment. Maybe the 1997–98 El Nino, which brought heavy flooding to Kenya, exacerbated the conditions for the spread of worms, especially at low elevations. And perhaps by chance the treatment schools were situated disproportionately at high elevations, so their kids fared better. This could explain all the results in Worms and its follow-ups. But the second link in that theory proved weak, especially when defining the treatment group as groups 1 and 2 together, as done in Worms at Work. Average elevation was essentially indistinguishable between the Worms at Work treatment and control groups. (Group 1 received treatment starting in 1998, group 2 in 1999, and group 3 in 2001, after the experiment ended.)
Nevertheless, my investigation of the first link in the theory led me to some interesting discoveries. To start, I directly tested the hypothesis that elevation mattered for impact by “interacting” elevation with the treatment indicator in a key Worms at Work regression. In the original regression, deworming is found to increase the logarithm of wage earnings by 0.269, meaning that deworming increased wage earnings by 30.8%. In the modified regression, the impact could vary with elevation in a straight-line way, as shown in this graph of the impact of deworming in childhood on log wage earnings in early adulthood as a function of school elevation:

The grey bands around the central line show confidence intervals rather as in the earlier graph on weight gains. The black dots along the bottom show the distribution of schools by elevation.
I was struck to find the impact confined to low schools. Yet it could be explained. Low schools are closer to Lake Victoria and the rivers that feed it; and their children therefore were more afflicted by schistosomiasis. In addition, geohelminths (soil-transmitted worms) might have spread more easily in the low, flat lands, especially after El Nino–driven floods. So lower schools may have had higher worm loads.[5]
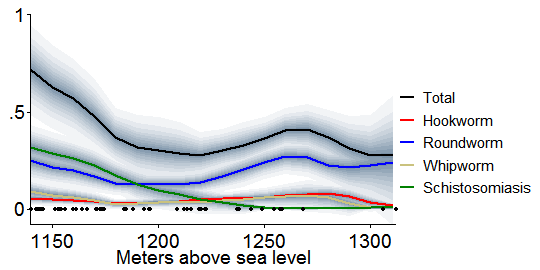
To fit the data more flexibly, I estimated the relationship semi-parametrically, with locally weighted regressions[6]. This involved analyzing whether among schools around 1140 meters, deworming raised wages; then the same around 1150 meters, and so on. That produced this Lowess-smoothed graph of the impact of deworming on log wage earnings:
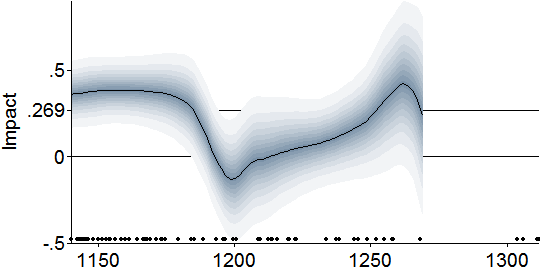
This version suggests that the big earnings impact occurred in schools below about 1180 meters, and possibly among schools at around 1250. (For legibility, I truncated the fit at 1270 meters; beyond which the confidence intervals explode for lack of much data.)
Motivated by the theory that elevation mattered for impact because of differences in pre-experiment infection rates, I then graphed how those rates varied with elevation, among the subset of schools with the needed data.[7] Miguel and Kremer measure worm burdens in three ways: prevalence of any infection, prevalence of moderate or heavy infection, and intensity (eggs/gram). So I did as well. First, this graph shows infection prevalence versus school elevation, again in a smoothed way:
Like the first table in this post, this graph shows that hookworms lived in nearly all the children, while roundworm and whipworm were each in about half. Not evident before is that schistosomiasis was common at low elevations, but faded higher up. Roundworm and whipworm also appear to fall as one scans from left to right, but then rebound around 1260 meters.
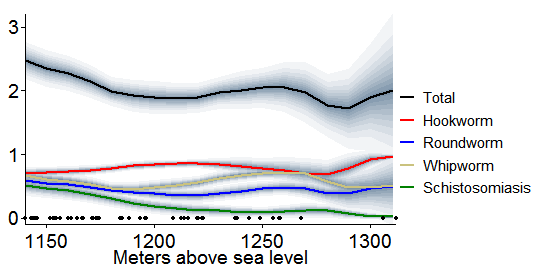
The next graph is the same except that it only counts infections that are moderate or heavy according to WHO definitions[8]:
Interestingly, restricting to serious cases enhances the similarity between the infection curves, just above, and the earlier smoothed graph of earnings impact versus elevation. The “Total” curve starts high, declines until 1200 meters or so, then peaks again around 1260.
Last, I graphed Miguel and Kremer’s third measure of worm burden, intensity, against elevation. Those images resemble the graph above, and I relegate them to a footnote for concision.[9]
These elevation-stratified plots teach three lessons. First, the similarity between the prevalence contours and the earnings impact contour shown earlier—high at the low elevations and then again around 1260 meters—constitutes circumstantial evidence for a sensible theory: children with the greatest worm burdens benefited most from treatment. Second, that measuring worm load to reflect intensity—moving to the graph just above from the one before—strengthens this resemblance and reinforces the notion of extrapolating from Worms at Work on the basis of intensity (average eggs/gram, not how many kids have any infection).
Finally, these patterns buttress the conclusion of my last post, that the Worms experiment mostly worked. If we grant that deworming probably boosted long-term earnings of children in Busia, then it becomes unsurprising that it did so more where children had more worms. But if we doubt the Worms experiments, then these results become more coincidental. For example, if we hypothesize that flawed randomization put schools whose children were destined to earn more in adulthood disproportionately in the treatment group, then we need another story to explain why this asymmetry only occurred among the schools with the heaviest worm loads. And all else equal, per Occam’s razor, more-complicated theories are less credible.
As I say, the evidence is circumstantial: two quantities of primary interest—initial worm burden and subsequent impact—relate to elevation in about the same way. Unfortunately, it is almost impossible to directly assess the relationship between those two quantities, to ask whether impact covaried with need. The Worms team did not test kids until their schools were about to receive deworming treatment “since it was not considered ethical to collect detailed health information from pupils who were not scheduled to receive medical treatment in that year.” My infection graphs are based on data collected at treatment-group schools only, just before they began receiving deworming in 1998 or 1999. Absent test results for control-group kids, I can’t run the needed comparison.
Contemplating the exploration to this point, I was struck to appreciate that while elevation might not directly matter for the impacts of deworming, like a saw through a log, introducing it exposed the grain of the data. It gave me insight into a relationship that I could not access directly, between initial worm load and subsequent benefit.
Mining in space
After I confronted the impossibility of directly testing whether initial worm burden influenced impact, I thought of one more angle from which to attack the question, if obliquely. This led me, unplanned, to explore the data spatially.
As we saw, nearly all children had geohelminths. So all schools were put on albendazole, whether during the experiment (for treatment groups) or not until after (control group). In addition, the pervasiveness of schistosomiasis in some areas called for a second drug, praziquantel. I sought to check whether the experiment raised earnings more for children in praziquantel areas. Such a finding could be read to say that schistosomiasis is an especially damaging parasite, making treatment for it especially valuable. Or, since the low-elevation schistosomiasis schools tended to have the highest overall worm burdens, it could be a sign that higher parasite loads in general lead to higher benefit from deworming.
Performing the check first required some educated guess work. The Worms data set documents which of the 50 schools in the treatment groups needed and received praziquantel, but not which of the 25 control group schools would have needed it in 1998–99. To fill in these blanks, I mapped the schools by treatment group and praziquantel status. Group 1 schools, treated starting in 1998, are green. Group 2 schools, treated starting in 1999, are yellow. And group 3 (schools not treated till 2001) are red. The white 0’s and 1’s next to the group 1 and 2 markers show which were deemed to need praziquantel, with 1 indicating need:
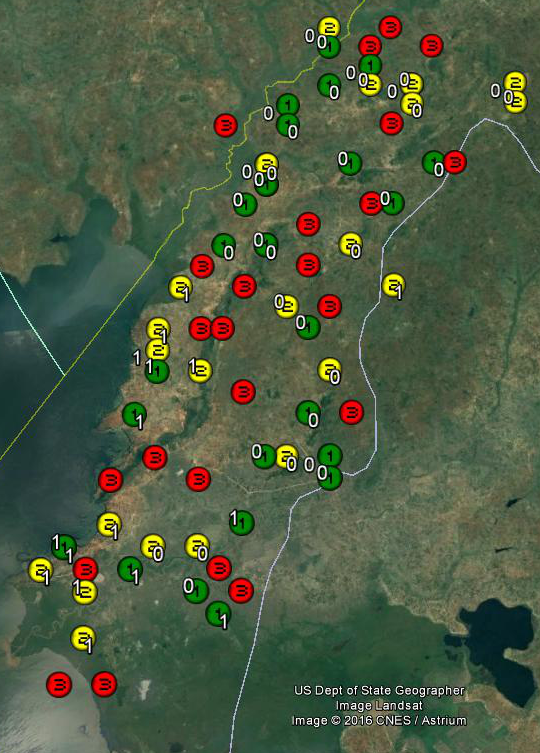
Most of the 1’s appear in the southern delta and along the shore of Lake Victoria. By eyeballing the map, I could largely determine which group 3 schools also needed praziquantel. For example, those in the delta to the extreme southwest probably needed it since all their neighbors did. I was least certain about the pair to the southeast, which lived in a mixed neighborhood, as it were; I arbitrarily marked one for praziquantel and one not.[10]
Returning to the Worms at Work wage earnings regression and interacting treatment with this new dummy for praziquantel need revealed no difference in impact between schools where only albendazole was deemed needed and given, and schools where both drugs were needed and given:

Evidently, treatment for geohelminths and schistosomiasis, where both were needed, did not help future earnings much more or less than treatment for geohelminths, where only that was warranted. So the comparison generates no strong distinction between the worm types.
After I mapped the schools, it hit me: I could make two-dimensional versions of my earlier graphs, slicing the data not by elevation, but by longitude and latitude.
To start, I fed the elevations of the 75 schools, marked below with white dots, into my statistics software, Stata, and had it estimate the topography that best fit. This produced a depiction of the contours of the land in southern Busia County, with the brightest reds indicating the highest areas:
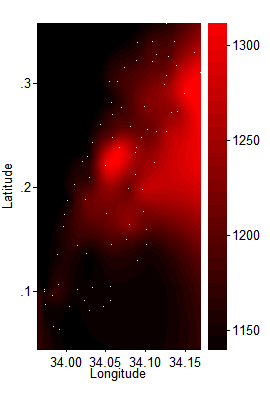
(Click image for a larger version.) I next graphed the impact of deworming on log wage earnings. Where before I ran the Worms at Work wage earnings regression centering on 1140 meters, then 1150, etc., now I ran the regression repeatedly across a grid, each time giving the most weight to the nearest schools [11]:
Two valleys of low impact dimly emerge, one toward the Lake in the south, one in the north where schools are higher up. Possibly these two troughs are linked to the undulations in my earlier, elevation-stratified graphs.
Next, I made graphs like these for all 21 baseline variables that Worms checks for balance—such as fraction of students who are girls and average age. All the graphs are here. Now I wonder if this was a mistake. None of the graphs fit the one above like a key in lock, so I found myself staring at blobs and wondering which vaguely resembled the pattern I sought. I had no formal, pre-specified measure of fit, which increased uncertainty and discretion. Perhaps it was just a self-administered Rorschach test. Yet the data mining had the power to dilute any p values from subsequent formal tests.
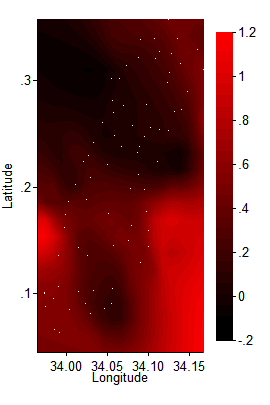
In the end, one variable caught my eye when mapped, and then appeared to be an important mediator of impact when entered into the wage earnings regression. It is: a child’s initial weight-for-age Z-score (WAZ), which measures a child’s weight relative to his or her age peers.[12] Here is the WAZ spatial plot. Compare it to the one just above. To my eye, where WAZ was high, subsequent impact was generally lower:
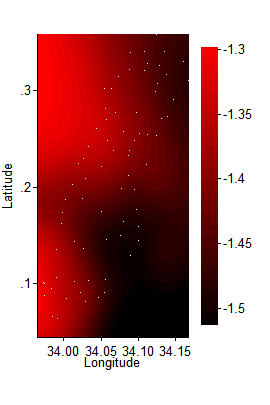
(Since most children in this sample fell below the reference median, their weight-to-age Z-scores were negative, so in here average WAZ ranges between –1.3 and about –1.5.)
Going back to two dimensions, this graph more directly checks the relationship I glimpsed above, by showing how the impact of deworming on wage earnings varied with children’s pre-treatment weight-to-age Z-score:
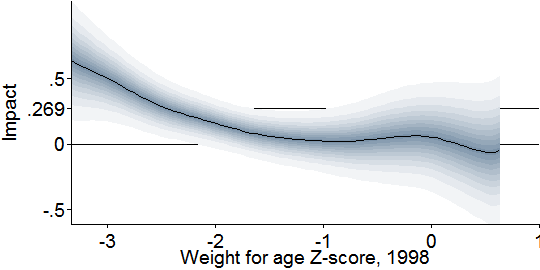
It appears that only children below –2, which is the standard definition of “underweight,” benefited enough from deworming treatment that it permanently lifted their developmental trajectories.
If the pattern is real, two dynamics could explain it. Children who were light for their age may have been so precisely because they carried more parasites, and were in deep need of treatment. Or perhaps other health problems made them small, which also rendered them less resilient to infection, and again more needful of treatment. The lack of baseline infection data for the control group prevents me from distinguishing between these theories.
Struck by this suggestion that low initial weight predicted impact, and mindful of the meta-analytic consensus that deworming affects weight, I doubled back to the original Worms study to ask a final question. Were any short-term weight gains in Busia concentrated among kids who started out the most underweight? This could link short-term impacts on weight with long-term impacts on earnings, making both more credible. I made this graph of the one-year impact of deworming treatment on weight-for-age Z-score versus weight-for-age Z-score before treatment (1998)[13]:
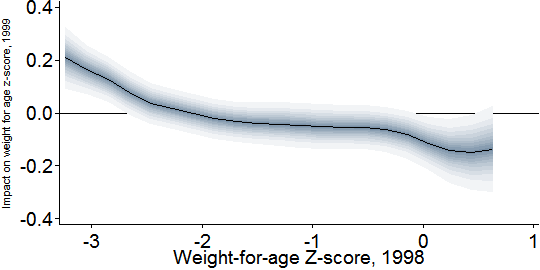
The graph seems to support my hypothesis. Severely underweight children (at or below –3) improve by about 0.2 points in Z-score. Underweight children (at or below –2) gain perhaps 0.1 on average.
But there is a puzzling twist. While treatment raised weight among the most severely underweight children, it apparently reduced the weight of the heaviest children. (Bear in mind that in registering just above 0, the highest-WAZ children in Busia were merely surpassing 50th percentile in the global reference population.) Conceivably, certain worm infections cause weight gain, which is reversed by treatment; but here I am speculating. Statisticians might wonder if this graph reveals regression toward the mean. Just as the temperature must rise after the coldest day of the year and fall after the hottest, we could expect that the children who started the experiment the most underweight would become less so, and vice versa. But since the graph compares treatment and control schools, regression toward the mean only works as a theory if it occurred more in the treatment group. That would require a failure of randomization. The previous post argued that the imperfections in the Worms randomization were probably not driving the main results; but possibly they are playing a larger role in these second-order findings about heterogeneity of impact.
Because of these doubts, and because I checked many hypotheses before gravitating to weight-for-age as a mediator of impact, I am not confident that physical health was a good predictor of the long-run impact of deworming on earnings. I view the implications of the last two graphs—that deworming increased weight in the short run and earnings in the long run only among the worst-off children—merely as intriguing. As an indicator of heavy worm burden or poor general health, low weight may have predicted impact. That hypotheses ought to probed afresh in other data, this time with pre-registered transparency. The results from such replication could then sharpen our understanding of how to generalize from Worms at Work.
But I emphasize that my earlier findings revolving around elevation are more confident, because they came out of a small and theoretically motivated set of hypotheses. At elevations where worms were more prevalent, deworming did more long-term good.
Conclusions
I glean these facts:
- Treatment of children known to carry worms improves their nutritional status, as measured by weight and height.
- Typically, a minority of children in today’s deworming settings are infected, so impacts from mass deworming are smaller and harder to detect.
- In meta-analyses, 95% confidence intervals for the impacts of mass deworming tend to contain zero.
- In the case of weight—which is among the best-studied outcomes and more likely to respond to treatment in the short run—Croke et al. improve the precision of meta-analysis. Their results are compatible with others’ estimates and make it appear unlikely that average short-term impact of mass deworming is zero or negative.
- Though the consensus estimate of about 0.1 kg for weight gain looks small, once one accounts for the youth and low infection rates of the children behind the number, it does not sit implausibly with the big long-term earnings benefit found in Worms at Work.
- Extrapolating the Worms at Work results to other settings in proportion to infection intensity (eggs/gram) looks reasonable. This will adjust for the likelihood that as prevalence of infection falls, prevalence of serious infection falls faster. Extrapolating this way might leave GiveWell’s cost-effectiveness rating for the Deworm the World unchanged while halving that for the Schistosomiasis Control Initiative (which is not a lot in calculations that already contain large margins of error).
- Within Busia, 1998–99, evidence suggests that the benefits of deworming were confined to children who were the worst off, e.g., who were more numerous at elevations with the most worm infections.
- To speak to the theme of the previous post, this hint of heterogeneity is harder to explain if we believe randomization failure caused the Worms at Work results.
- I did not find heterogeneity that could radically alter our appraisal of charities, such as signs that only treatment of schistosomiasis had long-term benefits.
This recitation of facts makes GiveWell’s estimate of the expected value of deworming charities look reasonable.
Yet, it is also unsatisfying. It is entirely possible that today’s deworming programs do much less, or much more, good than implied by the most thoughtful extrapolation from Worms at Work. Worms, humans, institutions, and settings are diverse, so impacts probably are too. And given the stakes in wealth and health, we ideally would not be in the position of relying so much on one experiment, which could be flawed or unrepresentative, my defenses notwithstanding. Only more research can make us more sure. If donors and governments are willing to spend nine-figure sums on deworming, they ought to devote a small percentage of that flow to research that could inform how best to spend that money.
Unfortunately, research on long-term impacts can take a long time. In the hope of bringing relevant knowledge to light faster, here are two suggestions. All reasonable effort should be made to:
- Gather and revisit underlying data (“microdata”) from existing high-quality trials, so that certain potential mediators of impact, such as initial worm load and weight, can be studied. This information could influence how we extrapolate from the studies we have to the contexts where mass deworming may be undertaken today. As a general matter, it cannot be optimal that only the original authors can test hypotheses against their data, as is so often the case. In practice, different authors test different outcomes measured different ways, reducing comparability across studies and eroding the statistical power of meta-analysis. Opportunities for learning left unexploited are a waste potentially measured in the health of children.
- Turn past short-term studies into long-term ones by tracking down the subjects and resurveying them.[14] This is easier said than done, but that does not mean a priori that it would be a waste to push against this margin.
Addition, January 9, 2017: One other short-term source of long-term evidence is the impending analysis of the 2011–14 follow-up on the Worms experiment, mentioned in the previous post. If the analysis of the impacts on earnings—which GiveWell has not yet seen—reveals impacts substantially different from those found in the previous round, this could greatly affect GiveWell’s valuations of deworming charities.
Notes
[1] Croke et al. do motivate their focus on weight in a footnote. Only three outcomes are covered by more than three studies in the Cochrane review’s meta-analyses: weight, height, and hemoglobin. Height responds less to recent health changes than weight, so analysis of impacts on height should have lower power. Hemoglobin destruction occurs most with hookworm, yet only one of the hemoglobin studies in the Cochrane review took place in a setting with significant hookworm prevalence.
[2] I thank Kevin Croke for pointing out the need for this adjustment.
[3] Columns S–W of the Parameters tab suggest several choices based on prevalence, intensity, or a mix. Columns Y–AC provide explanations. GiveWell staff may then pick from suggested values or introduce their own.
[4] Lo et al. 2016 fit quadratic curves for the relationship between average infection intensity among the infected (in eggs/gram) and prevalence of any infection. The coefficients are in Table A2. If we then assume that the distribution of infection intensity is in the (two-parameter) negative binomial family, fixing two statistics—prevalence and average intensity as implied by its quadratic relationship with prevalence—suffices to determine the distribution. We can then compute the number of people whose infection intensity exceeds a given standard. In the usual conceptual framework of the negative binomial distribution, each egg per gram is considered a “success.” A fact about the negative binomial distribution that helps us determine the parameters is P = 1–(1 + M/r)^(–r), where M is average eggs/gram for the entire population, including the uninfected; r is the dispersion parameter, i.e., the number of failures before the trials stop; and P is prevalence of any infection, i.e., the probability of at least one success before the requisite number of failures. One conceptual problem in this approach is that intensity in eggs/gram is not a natural count variable despite being modeled as such. Changing the unit of mass in denominator, such as to 100 mg, will somewhat change the simulation results. In the graphs presented here, I work with 1000/24 = 41.67 grams as the denominator since that is a typical mass on the slide of a Kato-Katz test and 24 is thus a standard multiplier when performing the test.
[5] I also experimented with higher-order polynomials in elevation. This hardly changed the results.
[6] I rerun the Worms at Work regression repeatedly while introducing weights centered around elevations 1140, 1150, …, etc. meters. Following the default in Stata’s lowess command, the kernel is Cleveland’s bicube. The bandwidth is 50% of the sample elevation span.
[7] The Worms research team tested random subsets of children at treatment schools just before they were treated, meaning that pre-treatment infection data are available for a third of schools (group 1) for early 1998 and another third (group 2) for early 1999. To maximize statistical power, I merge these pre-treatment samples. Ecological conditions changed between those two collection times, as the El Nino passed, which may well have affected worm loads. But pooling them should not cause bias if schools are reasonably well mixed in elevation, as they appear to be. Averages adjust for the stratification in the sampling of students for testing: 15 students were chosen for each school and grade.
[8] Miguel and Kremer modify the World Health Organization’s suggested standards for moderate infection, stated with reference to eggs per gram of stool. To minimize my discretion, I follow the WHO standards exactly.
[9] There are separate graphs for hookworm, roundworm, whipworm, and schistosomiasis. Here, the shades of grey do not signify levels of confidence about the true average value. Rather, they indicate the 10th, 20th, …, 90th percentiles in eggs per gram, while the black lines show medians (50th percentiles).
[10] Among the group 3 schools, I marked those which school identifiers 108, 218, 205, 202, 189, 167, 212, 211 as warranting praziquantel.
[11] The spatially smoothed impact regressions, and the spatially smoothed averages of baseline variables graphed next, are plotted using the same bandwidth and kernel as before, except that now distance is measured in degrees, in two dimensions. Since Busia is very close to the equator, latitude and longitude degrees correspond to the same distances. Locally weighted averages are computed at a 21×21 grid of points within the latitude and longitude spans of the schools. Points more than .05 degrees from all schools are excluded. Stata’s thin-plate-spline interpolation then fills in the contours.
[12] Weight-for-age z scores are expressed relative to the median of a reference distribution, which I believe comes from samples of American children from about 50 years ago. The WHO and CDC provide reference tables.
[13] The regressions behind the following two graphs incorporate all controls from the Baird et al. low wage earnings regression that are meaningful in this shorter-term context: all interactions of sex and standard (grade) dummies, zone dummies, and initial pupil population.
[14] This idea is inspired by a paper by Kevin Croke, although that paper links a short-term deworming study to long-term outcomes at the parish level, not the individual level.
Comments
David, do you think the correspondence between the shapes of the WAZ score and long term wage impact charts (i.e. the last two in the post) provides any additional evidence for the premise that weight-gain may be the mechanism through which long term impacts occur?
I hesitate to say yes to that, because I doubt that having more mass per se boosts one prospects, except perhaps in bumper cars. I don’t mean to be obtuse; it’s just that I don’t know if the weight gain is in muscle, fat, organs, maybe even the brain (as it might be in the toddlers). And if it’s mostly one of those, then weight gain would seem more like a visible correlate of the mechanism, rather than the mechanism per se. Or maybe improved nutrition causes weight gain and, separately, cognitive development with negligible weight impacts. These are the sorts of relationships I had in mind in writing that the short-term weight gains make the long-term earnings impact more credible. Weight gain seems to signify an improvement in health, whose precise nature we do not know. Maybe I should have made that clearer.
“Is 0.134 kg in weight gain compatible with 15% income gain 10 years later?”
All the assessment of causal mechanism hangs on this link, but I don’t think it’s fully addressed. What does the literature say about a 100 g gain through other means (food support, income support), is it consistent with that mean income gain? What’s known about that weight-income linkage?
Or you could focus on infected children, e.g. if 15% are infected and they gain 750 g, does that +750 g correspond to +100% income as it would to make the mean come out?
I’m surprised if the effects of nutrition are quite so huge, but if they are I need to learn more!
And it’s possible there’s no generalization from “weight gain following food intervention” over to “weight gain following health intervention”. But it would be worth knowing.
A doubling of income is just such a huge treatment effect, that if /nothing/ like that shows up under other interventions, something’s funny.
Hi eub,
Well, as the post discusses, the question is more like this: what does 0.1 kg weight gain among kids who were on average toddlers and had serious infections at a rate of 2%–16% tell us about the mechanism by which deworming teenagers with a 27% serious infection rate caused 15% income increases? I’d answer: not so much. What it does, though, is rebut the argument that the long-term impacts are implausible since there is no short-term impact.
–David
Thanks, I believe we have consistent pictures. I’d say you made a good case it’s not ‘strongly implausible for lack of a causal nexus’ — so maybe the ideal audience of the post is people who, like you, are acquainted with that as an existing argument. I, on the other hand, only met that argument in this post; you then knock it down, so I’m left where I was, about whether it’s a plausible effect. I don’t know. Appreciated your data analysis and discussion, however.
Hi David
I agree with eub’s question about how a ~100g weight gain in childhood could lead to substantial income/productivity increases in later life—eub is right that the whole causal mechanism hangs on that link. Your response to eub’s question doesn’t really address this – and actually, I think the burden of proof is on you to provide evidence that this is the case rather than for anyone else to prove that it isn’t. Your argument at the moment seems to be “Well, why shouldn’t this be true?”.
So, to make your answer clearer, please can you find me one example of decent-quality research in any discipline anywhere in the world that convincingly demonstrates that a modest non-specific weight gain at some point in childhood reliably results in itself in substantially higher income/productivity in adulthood? I’m genuinely curious to know if such evidence exists—I’m not aware of any myself, but it isn’t my specialist field. Obviously it is an attractive-sounding idea—but where+when it is scientifically demonstrated and in what circumstances?
I think the other problem with your chain-of-causation argument is that the original Miguel+Kremer 2004 study found no evidence of weight gain in the childhood mass deworming campaign that their work was based on. As you know, this is the study that underpins the later Worms at Work paper. To be clear, the authors? own point estimate of change in the WAZ (Weight-for-Age) z-score was 0.00 (see Table V, p173) and this was confirmed in our independent reanalysis in 2015. If you think there was a Height-for-Age (HAZ) benefit in M+K 2004, I suggest you check out our second 2015 paper (see Table 4, Davey et al, Int J Epi) before you go any further. These findings were based on weighing >6,000 children in the study a year after the first round of mass deworming, so are unlikely to result from inadequate sample size/time elapsed. So in this specific instance, which happens to be pretty-much the single study that your entire endorsement of 4 charities rests upon, there is no objective “process” evidence that your supposed causal mechanism was actually acting. Meta-analyses of whatever flavour aren’t relevant here—this is essentially just one self-contained experiment.
If you wanted to account for the above problems, how about introducing an extra few orders of magnitude into your uncertainty off-set for Worms at Work? Apparently Givewell thinks mass deworming is a good bet even with 99% discounting—so what about with 99.9% or 99.99%?
On the positive side (as far too many rude things have been said in the world of deworming research), I really like that you are calling for more research to be done into long-term impacts of deworming, and I think you could greatly expand on these sensible and pragmatic ways forward—would you have any interest in co-writing an opinion piece in this vein? As I’ve suggested previously, if the Worms at Work paper is so vital and highly-valued for GiveWell, why don’t you fund several teams of independent scientists to do replications based on the same raw data? You could ensure that they had produced pre-analysis plans in advance of examining the data, though the replicators would need to see the survey instrument and have a broad indication of what hypothesis they were aiming to test. Wouldn’t cost much and would be very quick—relatively-speaking.
Best wishes
Alex Aiken
Alex,
This comment mentions “your chain-of-causation argument” and “your supposed causal mechanism” but I don’t really see what these terms refer to. I don’t think I claim anywhere that weight gain causes higher earnings in adulthood. Nor, I believe, do I need to put forward a causal theory.
The post quotes Garner, Taylor-Robinson, and Sachdev as arguing that lack of short-term impact on measured biomedical outcomes renders “barely credible” any claims of longer-term impacts. While I think they over-interpret confidence intervals containing zero as evidence of zero impact, and while I argue against their premise of no impact, I think their core idea makes sense. If we find no short-term impact on certain indicators of nutrition, that should make claims about long-term earnings gains harder to believe. Yet I doubt that they assume that if impacts were found on one the measured outcomes, as I argue is the case, then one of those outcomes must directly cause any long-term gains. More likely, I would think, the short-term biomedical gains would be epiphenomena of less-observable biological processes. Likewise, in arguing with their premise I am not implying a theory of causation.
Is the burden on me to provide and prove such a theory? I don’t think so. In general, RCTs are better at telling us what happened to measured outcomes than why. When the first antibiotic was introduced 100 years ago the understanding of the mechanism must have been poor by today’s standards, but that did not in itself make introduction a mistake.
It seems to me that the best that can be said on behalf of your argument is that the more we understand any mechanism at work, the more confident we can be that mass deworming is worthwhile. So, in an honestly Bayesian framework, the more we know about mechanism, the more profoundly skeptical one’s prior about mass deworming would need to be for one’s mind not to be changed by that knowledge. Perhaps you can elaborate on why you believe that without a clear causal mechanism, we should not support mass deworming. Then, you might persuade others to adopt more skeptical priors.
My final graph essentially confirms what you say about zero short-term impact on weight in Worms. A gain manifests for the lowest-WAZ children and a loss for the highest-WAZ ones, and there’s not much change for those in between. But that does not undercut the apposition as I phrased it in my reply to eub: “what does 0.1 kg weight gain among kids who were on average toddlers and had serious infections at a rate of 2%–16% tell us about the mechanism by which deworming teenagers with a 27% serious infection rate caused 15% income increases?” This intervention seems to have accelerated weight gain in toddlers, presumably through better nutrition. How better nutrition would manifest in the Worms ~teenagers, I’m not sure.
Yes, the right discount could be 99.9% or 99.99%. Unfortunately, observing that truth does’t get us very far.
I appreciate your suggestions on funding and sense that it would be best not to discuss them further here.
–David
By the way, eub and Alex, there are studies that link health in childhood to productivity in adulthood. Here’s an extract from something I wrote a few years ago that has no web presence. Mostly it cites natural experiments, but the first is an experiment:
Side point: regarding Figure 2, you write:
“Each band depicts one of the confidence intervals I just cited. The varied shading reminds us that within each band, probability is highest near the center.”
Can you point to a source that explains the probability mass being highest at the point estimate? This is news to me.
Hi Michael,
To construct a confidence interval analytically requires a probability distribution, almost always the t or z, fundamentally because of the central limit theorem, by way of the distribution theory for ordinary least squares. These distributions have one peak and are symmetric. What is actually plotted above is the 95% CI, the 85% C, the 75% CI, etc., in graded shades. Here is the inspiration. The confidence with which one can reject given parameters falls as one approaches the peak/center. I’m trying to convey that idea while speaking to two audiences, expert and non-expert. If you can think of another felicitous way to express this idea to non-experts that is less confusing, let me know.
Confidence intervals are normally reported or depicted in ways that create the false impression, however subconscious, that confidence or probability is uniformly within their bounds. It isn’t.
–David
P.S. For some clear thinking on the meaning of confidence intervals, p values, etc., you might look at Greenland and Poole 2013 or Poole 1987 (“the p-value function allows the reader to think”).
Thanks David for the references. I think you may have the wrong hyperlink for the first study (the Guatemalan protein-drink study) – did you mean to link to Hoddinott et al, Lancet, 2008? That one is actually a very useful analogy: it showed experimental evidence of short-term anthropometric changes before the long-term productivity gains, which is unlike the Kenyan deworming study. The other studies are non-experimental, so are good to know about but less persuasive as demonstrations of causality.
To answer your question: epidemiologists like myself put value on understanding how something works because is it one of the Bradford Hill criteria for establishing causality (we call it biological plausibility). I accept that it isn’t an absolute requirement, and should thus be taken in the context of all the other evidence, such as the reproducibility and specificity of findings.
So what do you think these “less-observable biological processes” that are mediating this deworming effect might be? I think this comes down to one of those inter-disciplinary differences – you, as an economist, just seem to be more comfortable than me with a black box explanation.
I only mentioned the Givewell 99% offset as I’ve just read a forthcoming paper about another mass deworming trial. If new evidence were to emerge that indicated mass deworming interventions don’t always achieve the things that proponents hope for, at some point Givewell would have to consider increasing this offset – presumably that is how Bayesians respond to new evidence?
Oh sorry, I fixed the link. The article I had in mind actually appeared in 2013. Unfortunately, the experiment in that case used matched-pair randomization with only two pairs, so it is not head-and-shoulders above the natural experiments in credibility.
I agree that a verified causal theory adds credibility and that in general it is not an absolute requirement.
I feel pretty unqualified to speculate as to biological mechanism.
Yes, I certainly hope GiveWell is capable of updating in response to new information. That said, I’d need to understand the specifics of this new study. I’ve been reading a lot of literature lately that equates “insignificant at 0.05” with “no evidence of an effect” or even “evidence of no effect,” and I’m feeling pretty jaded. Don’t expect a major update merely because the 95% CIs include zero (if that happens to be the situation). Is the study short-term or long-term? Assuming it is short-term, I’d want to know how adding it affects Croke et al.’s meta-analytical estimate of weight impact (since that meta-analysis appears most precise, pooling the most information). Put another way, I’d want to know how strongly the new study rejects an impact of ~0.1 kg, or some corresponding number adjusted for differences in prevalence and age.
Yesterday, I appended a paragraph to the post about a source of evidence that I think has more potential to update our beliefs and recommendations, and soon: the next-round Worms follow-up. As in all this writing, I officially speak only for myself.
–David
David, belated thanks for your Jan 9 collection of references, which look interesting.
Great detail!
This is a more general comment on health outcomes, as before reading this I was looking at Givewell’s health priorities.
I studied medicine and then worked in health promotion in India, Madagascar and West Africa.
Looking at this (https://blog.givewell.org/2015/10/15/charities-wed-like-to-see/), it’s not bad and some is quite good, but:
– mass media to promote behaviour change has been done a lot, notably by http://www.basics.org, various UK health charities, Childline, Samaritans, FGM charities; UK governments nudge unit is another approach.
– WFP UNICEF governments and many others do micronutrient fortification, and some food corporations do it routinely,
– Bednets and deworming important, but you have to keep it up and be thorough, so educating teens about these issues may be a cheaper way to get long term consistent implementation, but when has health ever been a main school subject?. CLTS (community-led total sanitation) is the big new buzz.
WHO have lots of data, also Institute of Child Health, and IDS Sussex has mountains of participatory evaluations (google: “PLA notes” as a starting point) many indexed against measured data and monitoring. The Canadian iisd is also good.
Comments are closed.