2011 saw strong growth for GiveWell’s web traffic and “money moved” (dollars given based on our recommendations). This is our final quarterly report for the year, and most meaningful since it includes December (when we see the vast majority of our “money moved”).
The numbers in this post are preliminary. We continue to learn about additional donations due to our research and will post an updated report when we publish our annual review in the coming weeks.
Money moved
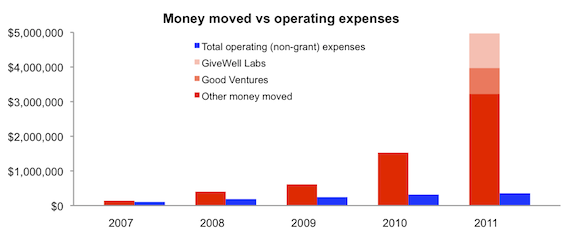
By “money moved” we mean donations that we can confidently identify as being made on the strength of our recommendations. The following chart shows growth in overall money moved and compares this to GiveWell’s operating expenses. Overall money moved includes all donations driven by GiveWell, including $750,000 committed by Good Ventures to our top two charities and $1 million committed to GiveWell Labs (the latter funding has not yet been allocated to specific organizations). Note that we count “money moved” when it is committed, rather than when it is disbursed.

The table below show dollars donated and number of donations in 2008-2011 through our website. While money moved through the website is only a fraction of overall money moved, we believe this is a meaningful metric for tracking our progress/growth; total money moved, which includes mostly larger gifts that are “lumpier” and more unpredictable, is a better metric of our overall influence.
Overall, growth in 2011 was strong.
| Year | Money moved through website | Annual growth in money moved through website | Number of donations | Annual growth in number of donations |
|---|---|---|---|---|
| 2008 | $35,021 | – | 130 | – |
| 2009 | $143,013 | 308% | 665 | 412% |
| 2010 | $399,456 | 179% | 976 | 47% |
| 2011 | $1,305,089 | 227% | 3,099 | 218% |
Below we break down money moved by charity. A few notes on this table:
- The majority of the donations have gone to our #1 and #2 charities, Against Malaria Foundation and Schistosomiasis Control Initiative.
- VillageReach, which was our #1 charity until November 2011 (when we decided to replace it due to limited room for more funding), also received significant funding in the first 11 months of the year.
- The next 6 charities in the table are our standout organizations.
- We have recommended Doctors Without Borders for its work in disaster situations, such as the famine in Somalia, and we have recommended Nurse-Family Partnership for its work in the U.S.
- “Other organizations” includes donations to 9 organizations we have recommended in the past, such as PSI, Village Enterprise Foundation, Stop TB Partnership, and Invest in Kids.
- The “allocation not yet decided/known” includes about $34,000 in donations to GiveWell designated for regranting to recommended charities, and about $45,000 in donations through Network for Good, a donation processor (we have not yet received information from Network for Good on which organizations received this funding).
| Charity | Total money moved |
|---|---|
| Against Malaria Foundation | $2,160,787 |
| Schistosomiasis Control Initiative | $658,091 |
| VillageReach | $608,444 |
| Nyaya Health | $110,759 |
| GiveDirectly | $86,146 |
| Small Enterprise Foundation | $78,170 |
| KIPP/KIPP Houston | $58,504 |
| Pratham | $45,813 |
| Innovations for Poverty Action | $36,969 |
| Doctors Without Borders (MSF) | $27,392 |
| Nurse-Family Partnership | $17,280 |
| Other organizations | $29,509 |
| Allocation not yet decided/known | $83,464 |
| Committed to GiveWell Labs | $1,000,000 |
| Total | $5,001,328 |
Web traffic
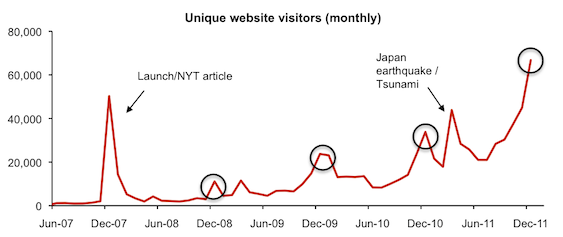
The chart below show our web traffic over time, as measured by unique visitors each month. There are seasonal spikes each December when interest in charitable giving peaks (circled in the chart below). We label other spikes.


Comments
Thanks for the insights into the traffic, great to see that the blog is doing good. All the best for 2012.
This is extremely helpful insight, thank you. I wish every non-profit did this! It’s very encouraging that your low traffic point in June 2011 was as high as your peak traffic point in Dec 2009.
Comments are closed.