When our cost-effectiveness analysis finds robust and meaningful differences between charities, it plays a large role in our recommendations (more on the role it plays in this post).
But while our cost-effectiveness analysis represents our best guess, it’s also subject to substantial uncertainty; some of its results are a function of highly debatable, difficult-to-estimate inputs.
Sometimes these inputs are largely subjective, such as the moral weight we assign to charities achieving different good outcomes (e.g. improving health vs. increasing income). But even objective inputs are uncertain; a key input for anti-malaria interventions is malaria mortality, but the Institute for Health Metrics and Evaluation estimates 1.6 times more people died in Africa from malaria in 2016 (641,000) than the World Health Organization does (407,000; pg. 41).1Differences in their methodologies have been discussed, with older figures, in a 2012 blog post by the Center for Global Development.
Before we finalized the charity recommendations we released in November, we determined how sensitive our results were to some of our most uncertain parameters.
In brief:
- Comparisons between charities achieving different types of good outcomes are most sensitive to the relative value we assign to those outcomes (more on how and why we and other policymakers assign these weights in this post).
- Our deworming models are very uncertain, due to the complexity of the evidence base. They are also sensitive to the choice of discount rate: how we value good done today vs. good done in the future.
- Our malaria models (seasonal malaria chemoprevention and long-lasting insecticide-treated nets) are less uncertain than our deworming models, but are particularly sensitive to our estimate of the long-term effects of malaria on income.
In this post, we discuss:
- The sensitivity of our analysis to moral weights (more) and other parameters (more).
- How this uncertainty influences our recommendations (more).
- Why this sensitivity analysis doesn’t capture the full scope of our uncertainty and ways in which we could improve our assessment and presentation of uncertainty (more).
The tornado charts at the bottom of this post show the results of our full sensitivity analysis. For a brief explanation of how we conducted our sensitivity analysis, see this footnote.2Each contributor to our cost-effectiveness analysis inputs their own values for particularly uncertain parameters. We use the median of contributors’ final cost-effectiveness results for our headline cost-effectiveness figures. To simplify the sensitivity analysis, we used the median of contributors’ parameter inputs to form a central cost-effectiveness estimate for each charity. The results below therefore differ slightly from our headline cost-effectiveness figures. To determine how sensitive the model is to each parameter, we flexed each parameter between the highest and lowest contributors’ inputs, while holding all other parameters constant. For more details, see our sensitivity analysis spreadsheet.
Sensitivity to moral weights
Some of the inputs in our model rely on judgement calls, which reasonable, informed people might disagree on. For example, we assign quantitative weights to our relative valuations of different good outcomes. These inputs capture important considerations in our decision-making, but are often difficult to justify precisely.
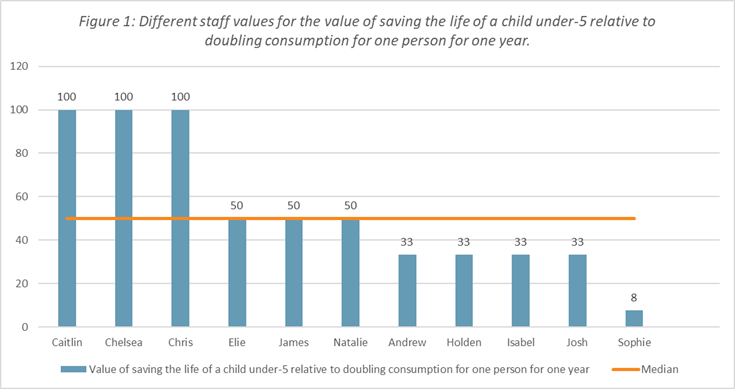
We ask contributors to our cost-effectiveness analysis (mostly staff) to input how many people’s income would have to double for 1 year to be equally valuable to averting the death of a child under 5 years old. Contributors’ values vary widely, between 8 and 100 (see Figure 1).3You can see each of our contributors’ inputs for moral weights, and other uncertain parameters, on the Moral weights and Parameters tabs of our cost-effectiveness analysis. This year, contributors were also asked to provide a brief justification for their inputs in the cell notes.
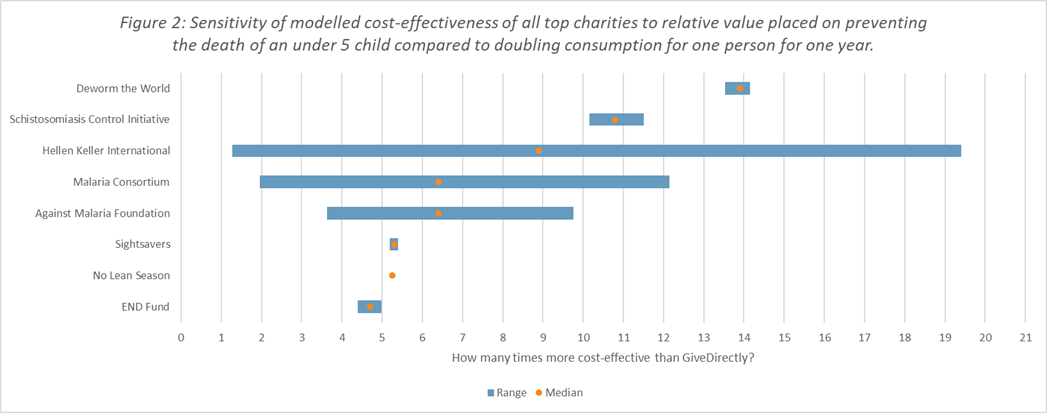
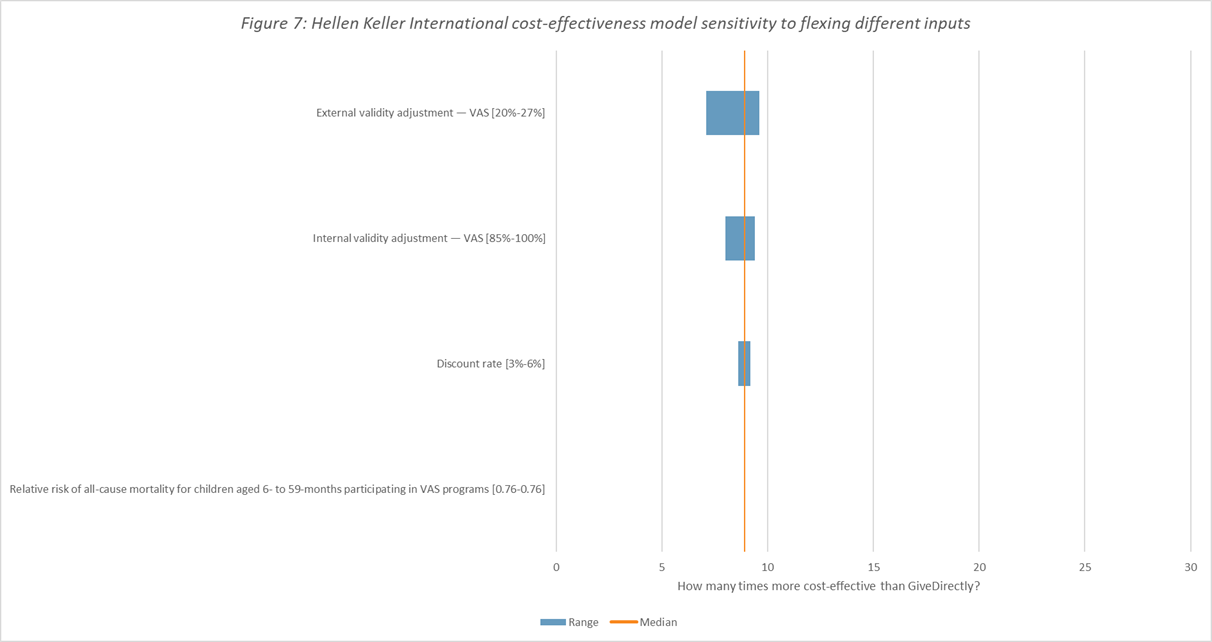
Differences in cost-effectiveness between charities that primarily prevent child deaths (Helen Keller International’s vitamin A supplementation program, Malaria Consortium’s seasonal malaria chemoprevention program, and the Against Malaria Foundation) and charities that primarily increase income or consumption (Evidence Action’s Deworm the World Initiative, the Schistosomiasis Control Initiative, Sightsavers’ deworming program, the END Fund’s deworming program, Evidence Action’s No Lean Season, and GiveDirectly) are highly sensitive to different plausible moral weights (See Figure 2).
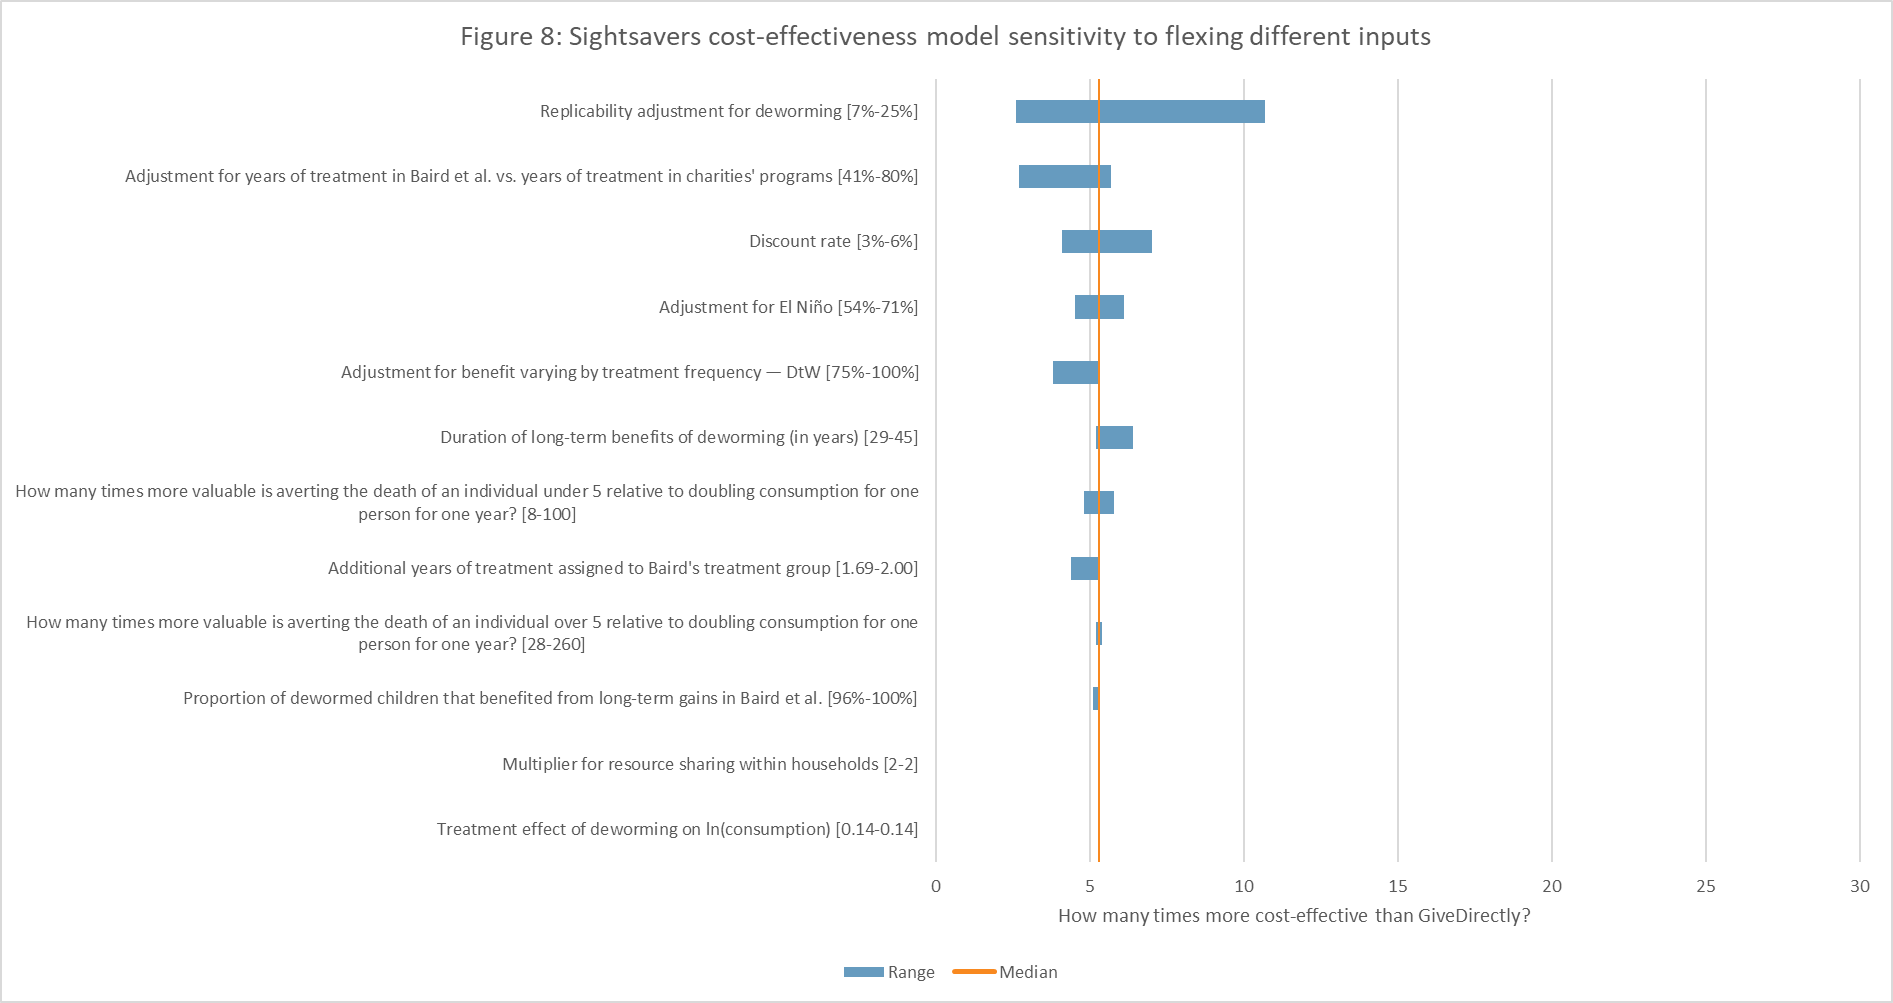
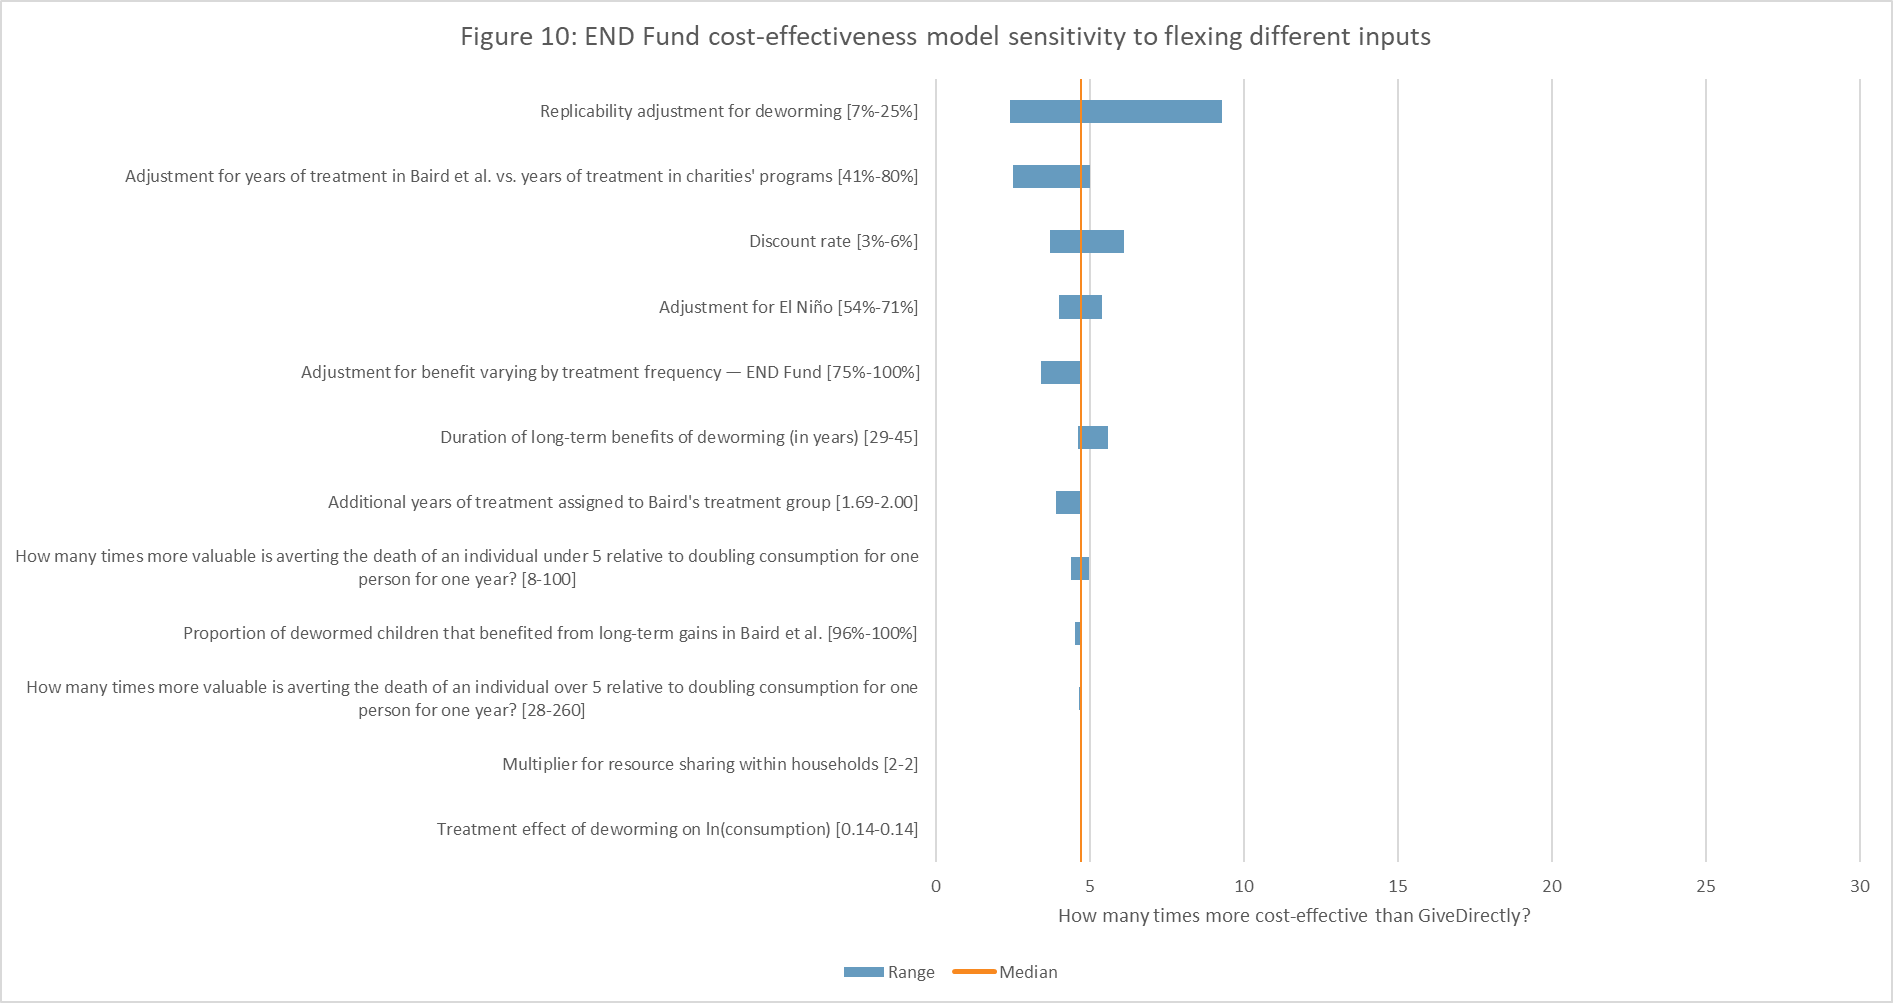
Deworming sensitivities
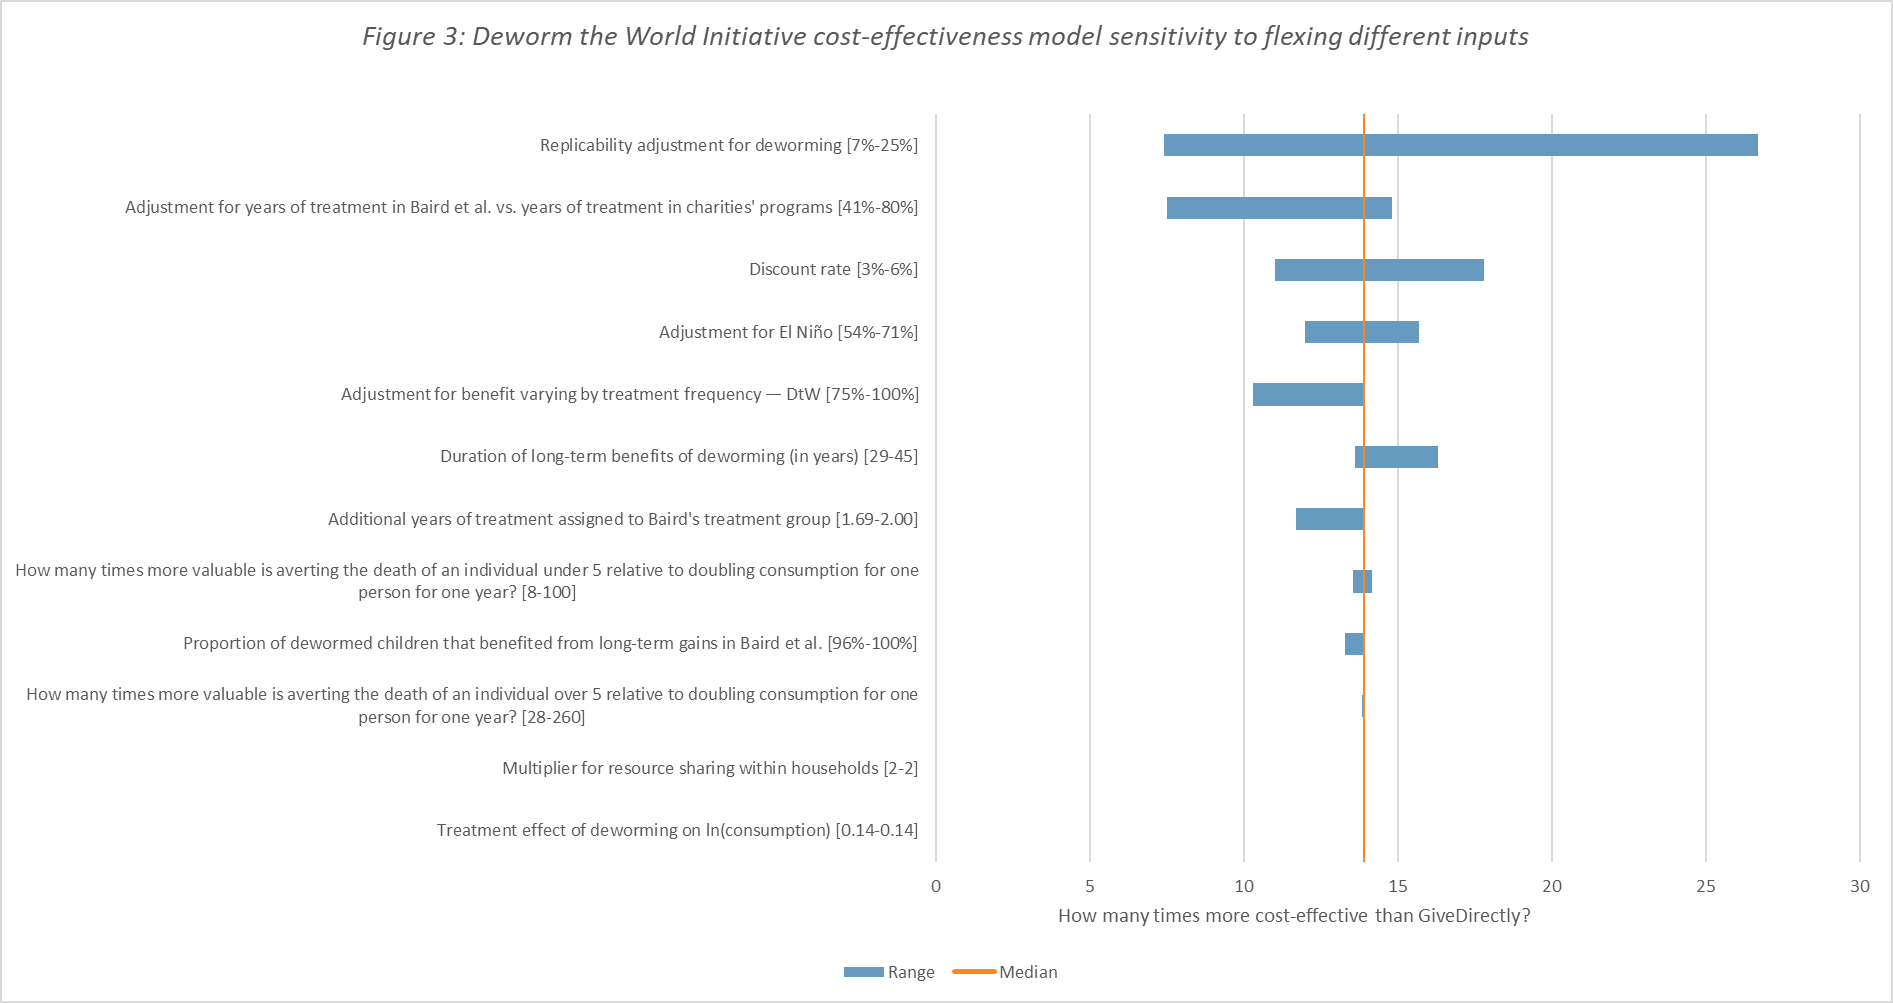
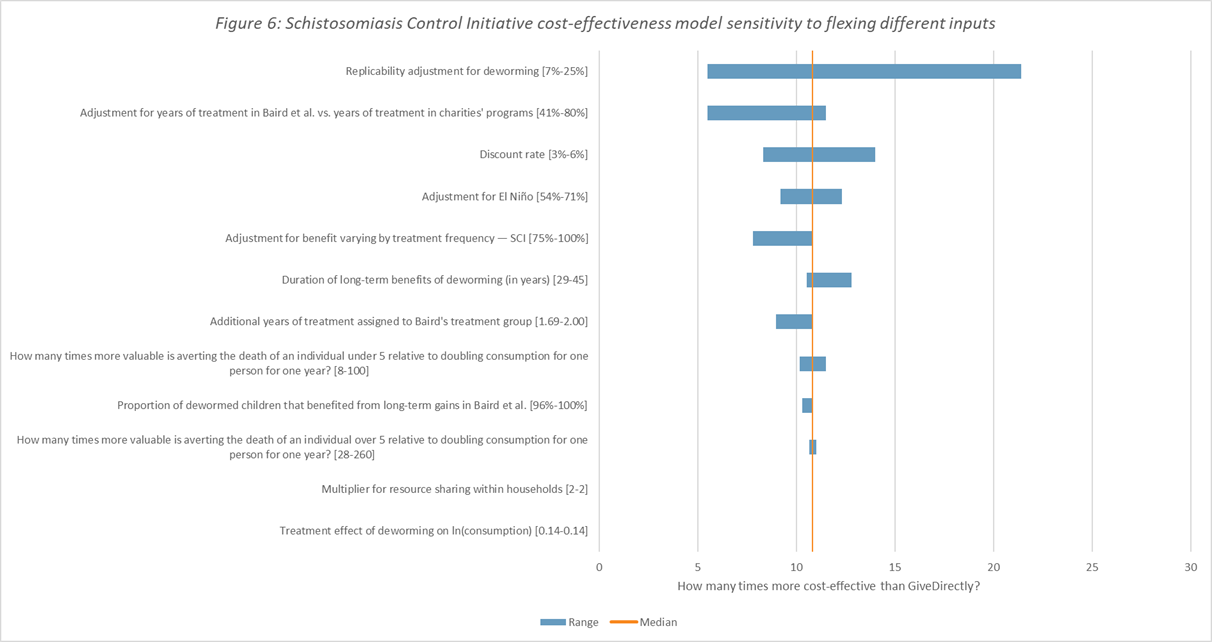
Our deworming models are very uncertain, due to the complexity of the evidence base and the long time horizons over which we expect the potential benefits to be realized. Aside from our moral weights, our deworming charities are highly sensitive to three inputs:
- Replicability adjustment. We make a “replicability adjustment” for deworming to account for the fact that the consumption increase in a major study we rely upon may not hold up if it were replicated. If you’re skeptical that such a large income increase would occur, given the limited evidence for short-term health benefits and generally unexpected nature of the findings, you may think that the effect the study measured either wasn’t real, wasn’t driven by deworming, or relied on an atypical characteristic shared by the study population but not likely to be found among recipients of the intervention today. This adjustment is not well-grounded in data. (For more discussion, see our deworming intervention report and blog posts here, here, here, and here).4You can read more about how contributors settled on the values they used for this parameter in the cell notes in row 16 of the Parameters sheet of our November 2017 cost-effectiveness model.
- Adjustment for years of treatment in Baird et al. 2015, a key study we rely on in our assessment of deworming, vs. years of treatment in charities’ programs. Our charities aim to deworm children for up to 10 years, which is longer than the intervention studied in Baird et al. 2015 (where children in the treatment group received 4 years of deworming). There may be diminishing returns as the total years of treatment increase, although this is difficult to estimate.
- Discount rate. The discount rate adjusts for benefits that occur at different points in time. For a number of reasons, individuals may believe it is preferable for income to rise now rather than at some point in the future.
Figure 3 shows how the cost-effectiveness of Deworm the World Initiative5The sensitivity of other deworming charities is largely dependent on the same parameters. Charts are presented in the Appendix. varies depending on different contributor inputs for different parameters (more on how to interpret these parameters here).
Malaria sensitivities
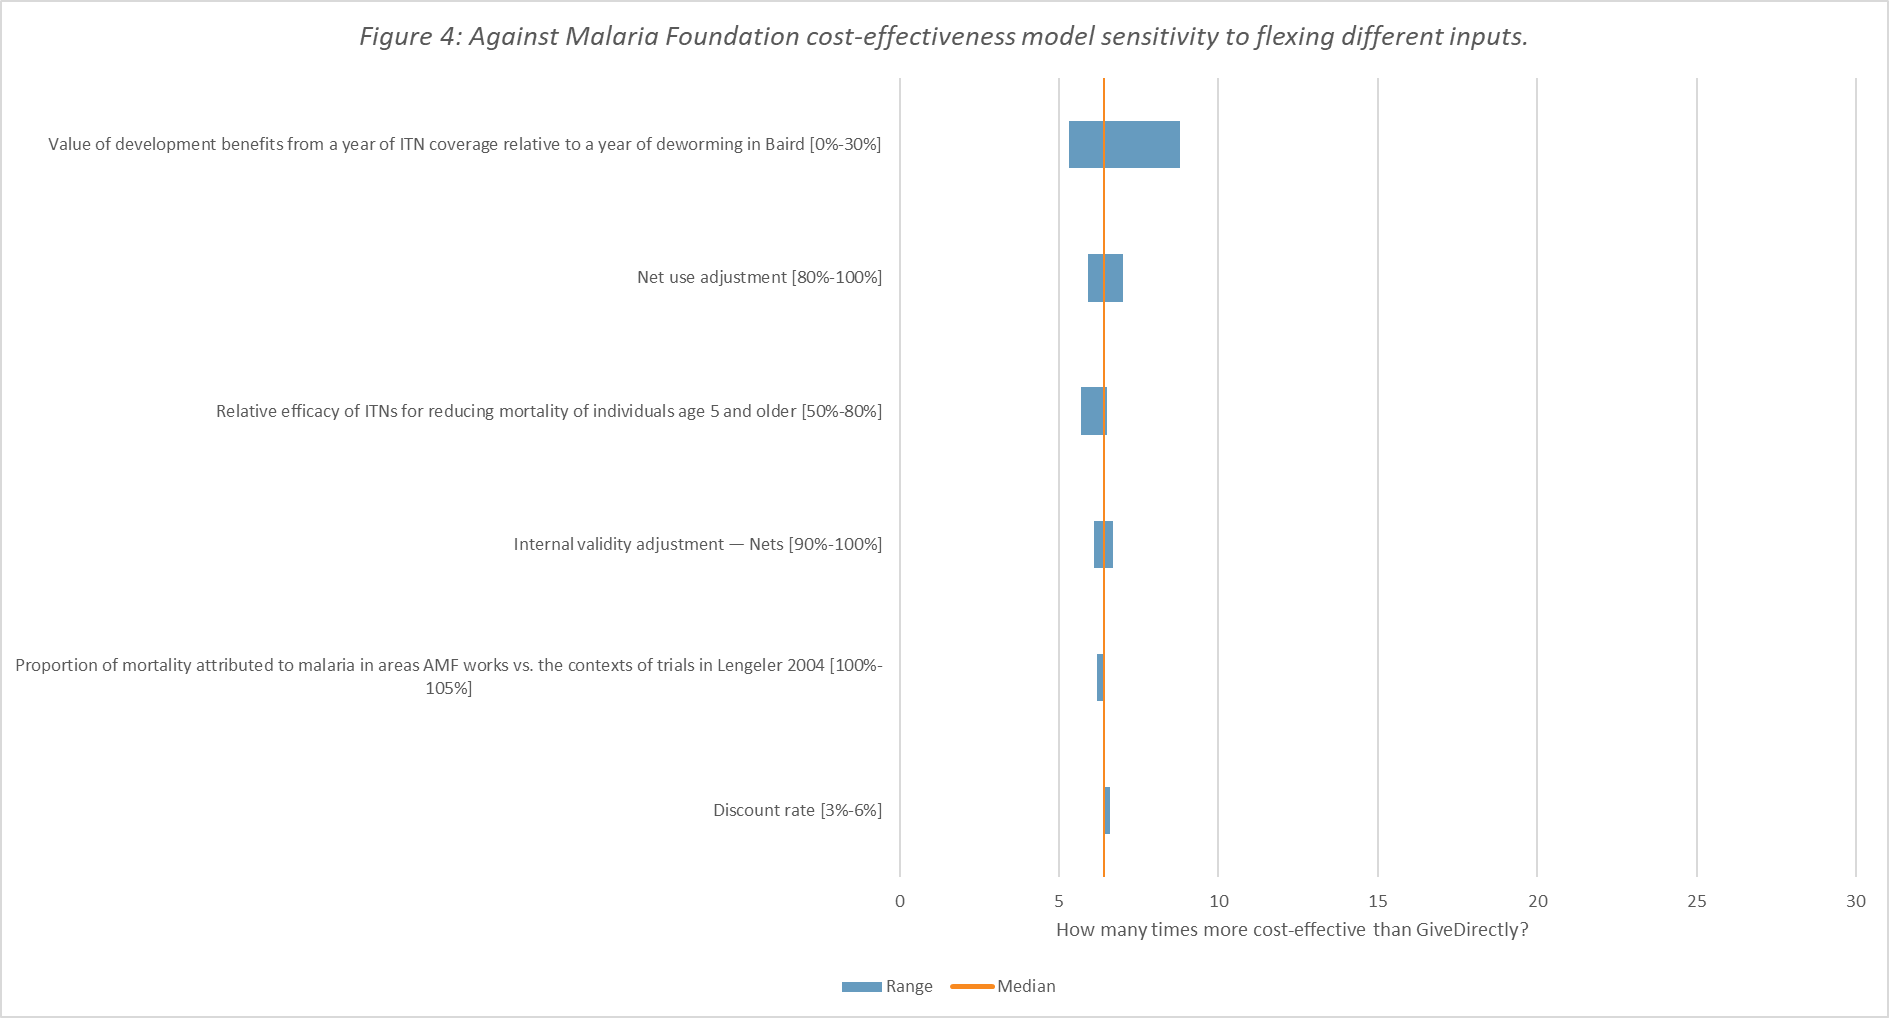
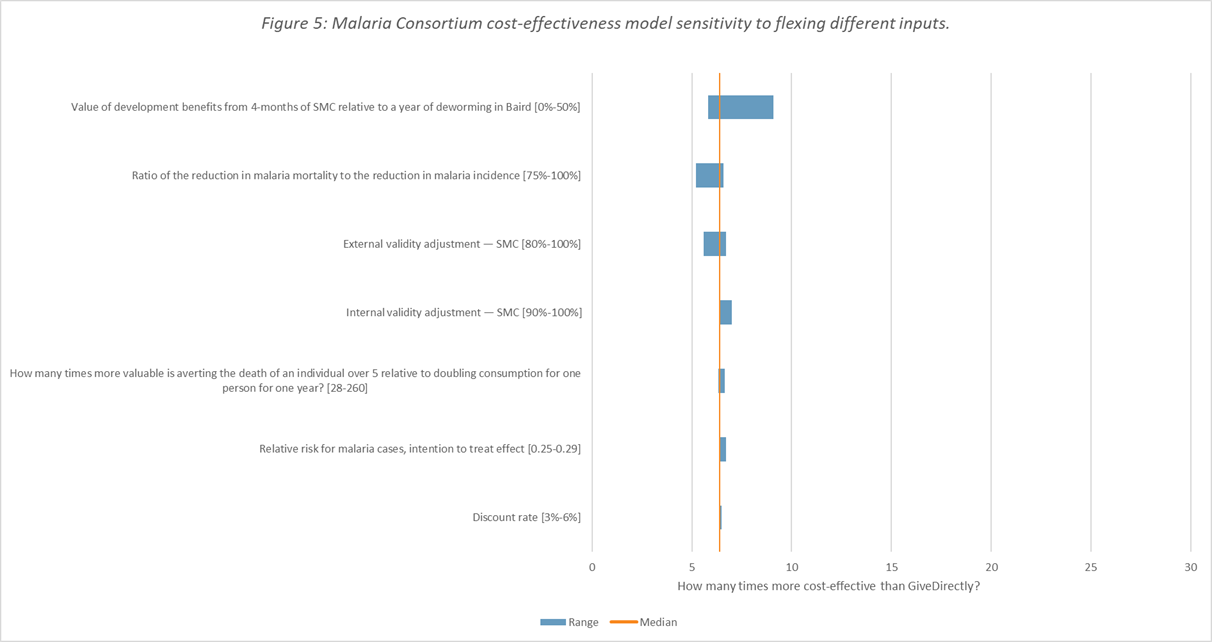
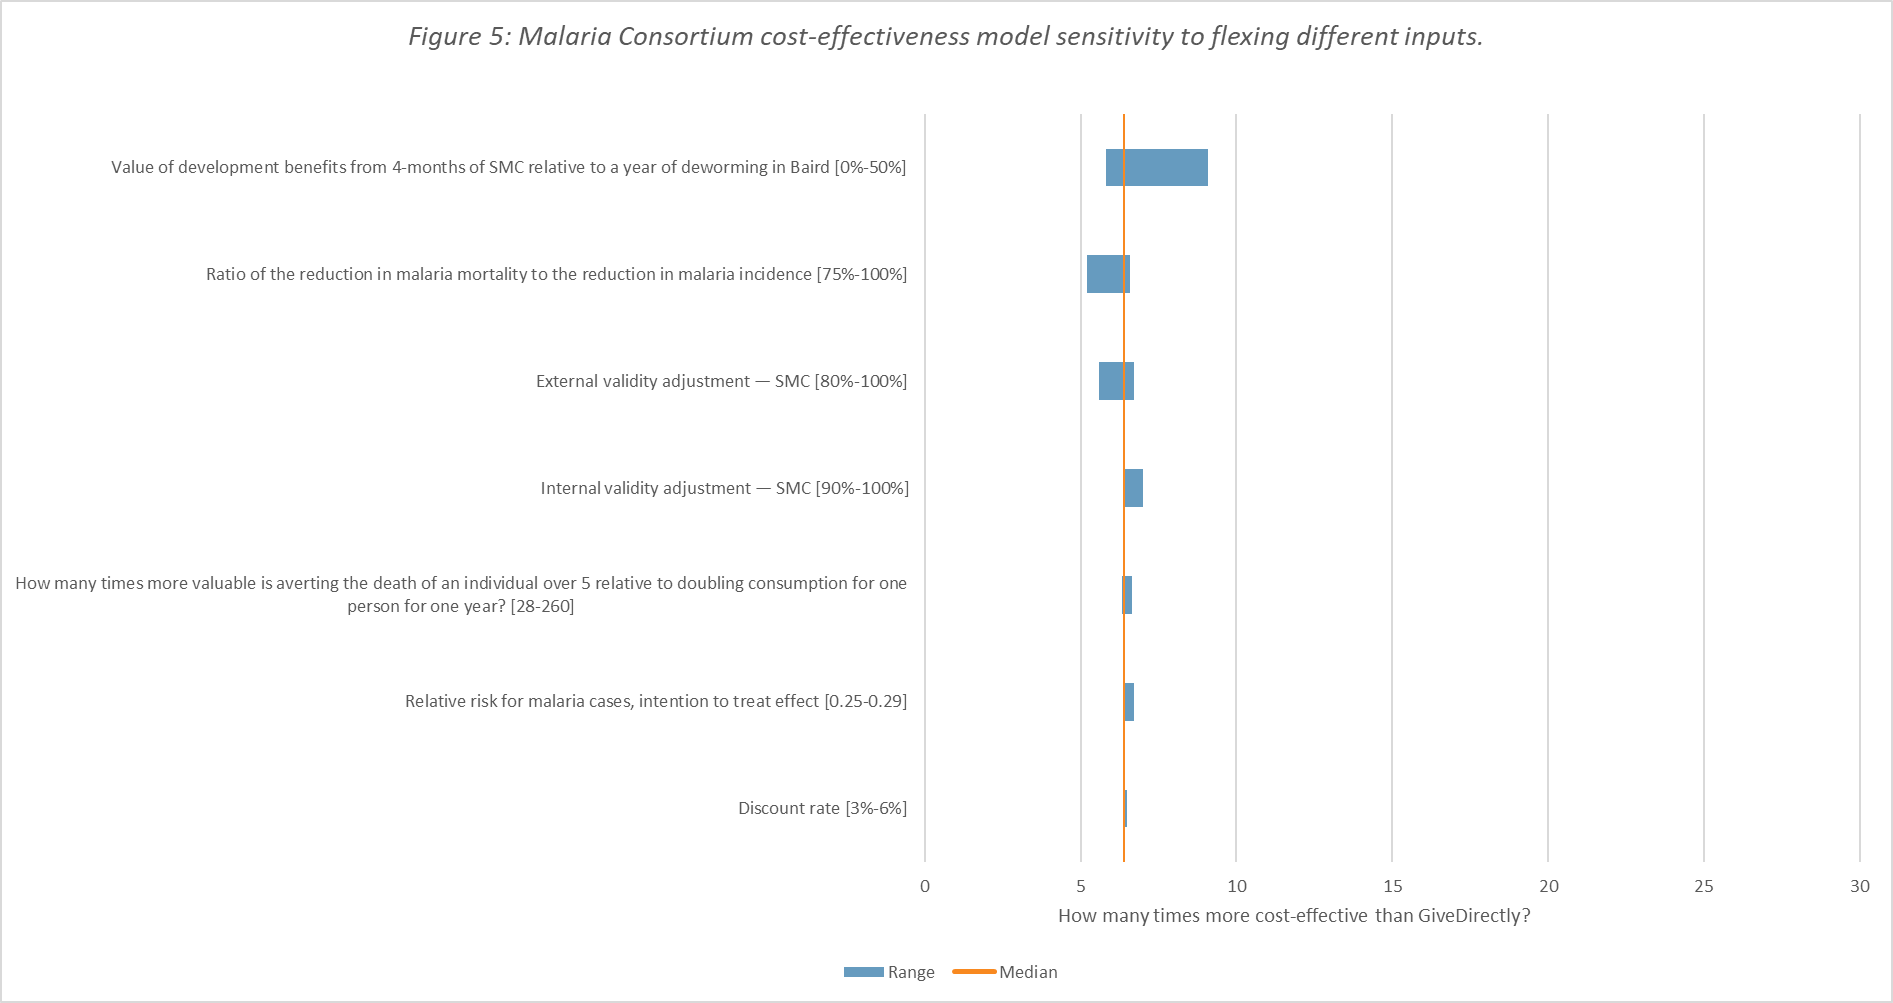
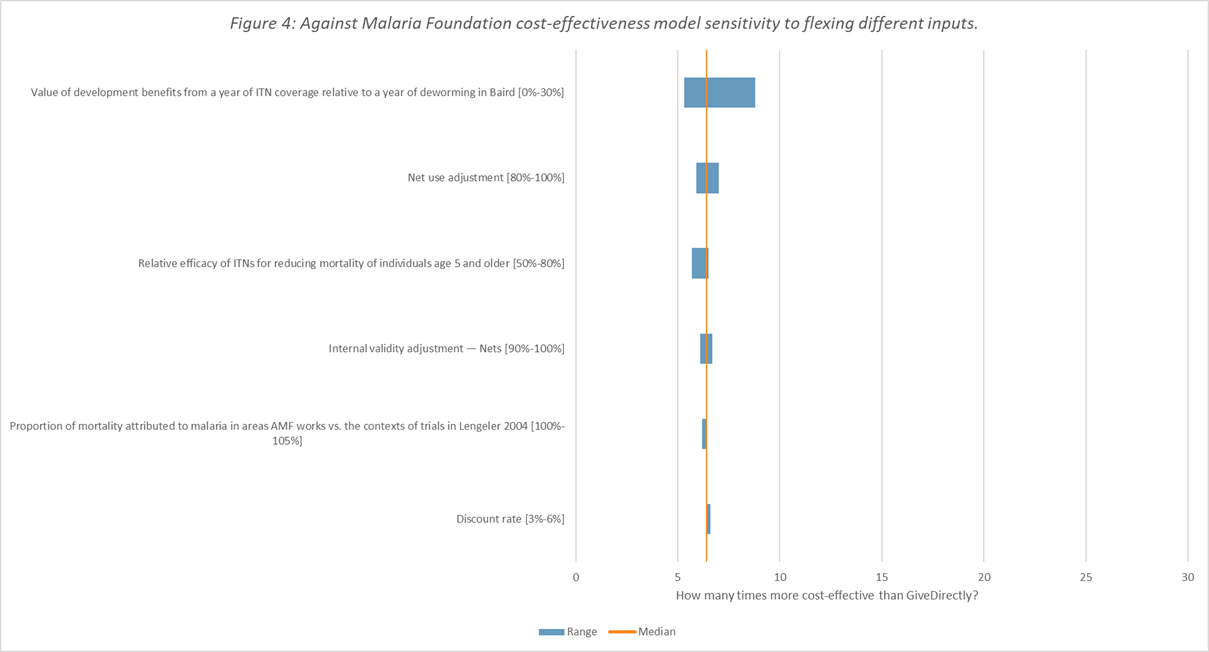
Our malaria models are less uncertain than our deworming models, but are still sensitive to our estimate of the long-term effects of malaria on income (see Figures 4 and 5).
Interpreting the evidence base for the effect of malaria prevention on long-run income is complex, and contributors differ widely in their interpretation. We’re planning to do more research on this topic but summarize our current understanding here.
What does this mean for our recommendations?
When we model large differences in cost-effectiveness, we generally follow those differences in making our recommendations. When charities are closer in cost-effectiveness, we pay more attention to qualitative considerations, such as the quality of their monitoring and evaluation, and potential upside benefits that are difficult to quantify (e.g. scaling a novel program).
What counts as a meaningful difference in modelled cost-effectiveness depends on a number of factors, including:
- Do the programs target the same outcomes? We place less weight on modelled differences between charities that have different good outcomes because our cost-effectiveness analysis is sensitive to different reasonable moral weights.
- How similar are the programs? We’re more confident in our comparison between our deworming charities than we are between deworming charities and other charities targeting increases in consumption, such as GiveDirectly. This is because we expect the most likely errors in our deworming estimates (e.g. based on our interpretation of the evidence) for different charities to be correlated.
- Are there important qualitative reasons to differentiate between the charities? We place less relative weight on our cost-effectiveness analysis when there are important qualitative reasons to differentiate between charities.
For a more detailed explanation of how we made our recommendations this year, see our recent announcement of our top charities for giving season 2017.
What are the limitations of this sensitivity analysis?
This sensitivity analysis shouldn’t be taken as a full representation of our all-things-considered uncertainty:
- The charts above show the sensitivity of the cost-effectiveness analysis to changing one input at a time (holding all others constant). The ranges don’t necessarily imply any particular credible interval, and are more useful for identifying which inputs are most uncertain than for reflecting our all-things-considered uncertainty around the cost-effectiveness of a particular charity.
- We don’t ask multiple contributors to input their own values for all uncertain inputs (e.g. because we think the benefits of using the inputs of the contributors with most context outweigh the benefit of getting inputs from many contributors). These inputs have not been included in the sensitivity analysis.
- Model uncertainty. Explicitly modelling all the considerations relevant to our charities would be infeasible. Even if all our inputs were fully accurate, we’d still retain some uncertainty about the true cost-effectiveness of our charities.
We’re considering a number of different options to improve our sensitivity analysis and communication of uncertainty in the future, such as expressing inputs as probability distributions or creating a Monte Carlo simulation. But we’re uncertain whether these would create sufficient decision-relevant information for our readers to justify the substantial time investment and additional complexity.
If you’d find such an analysis helpful, let us know in the comments.
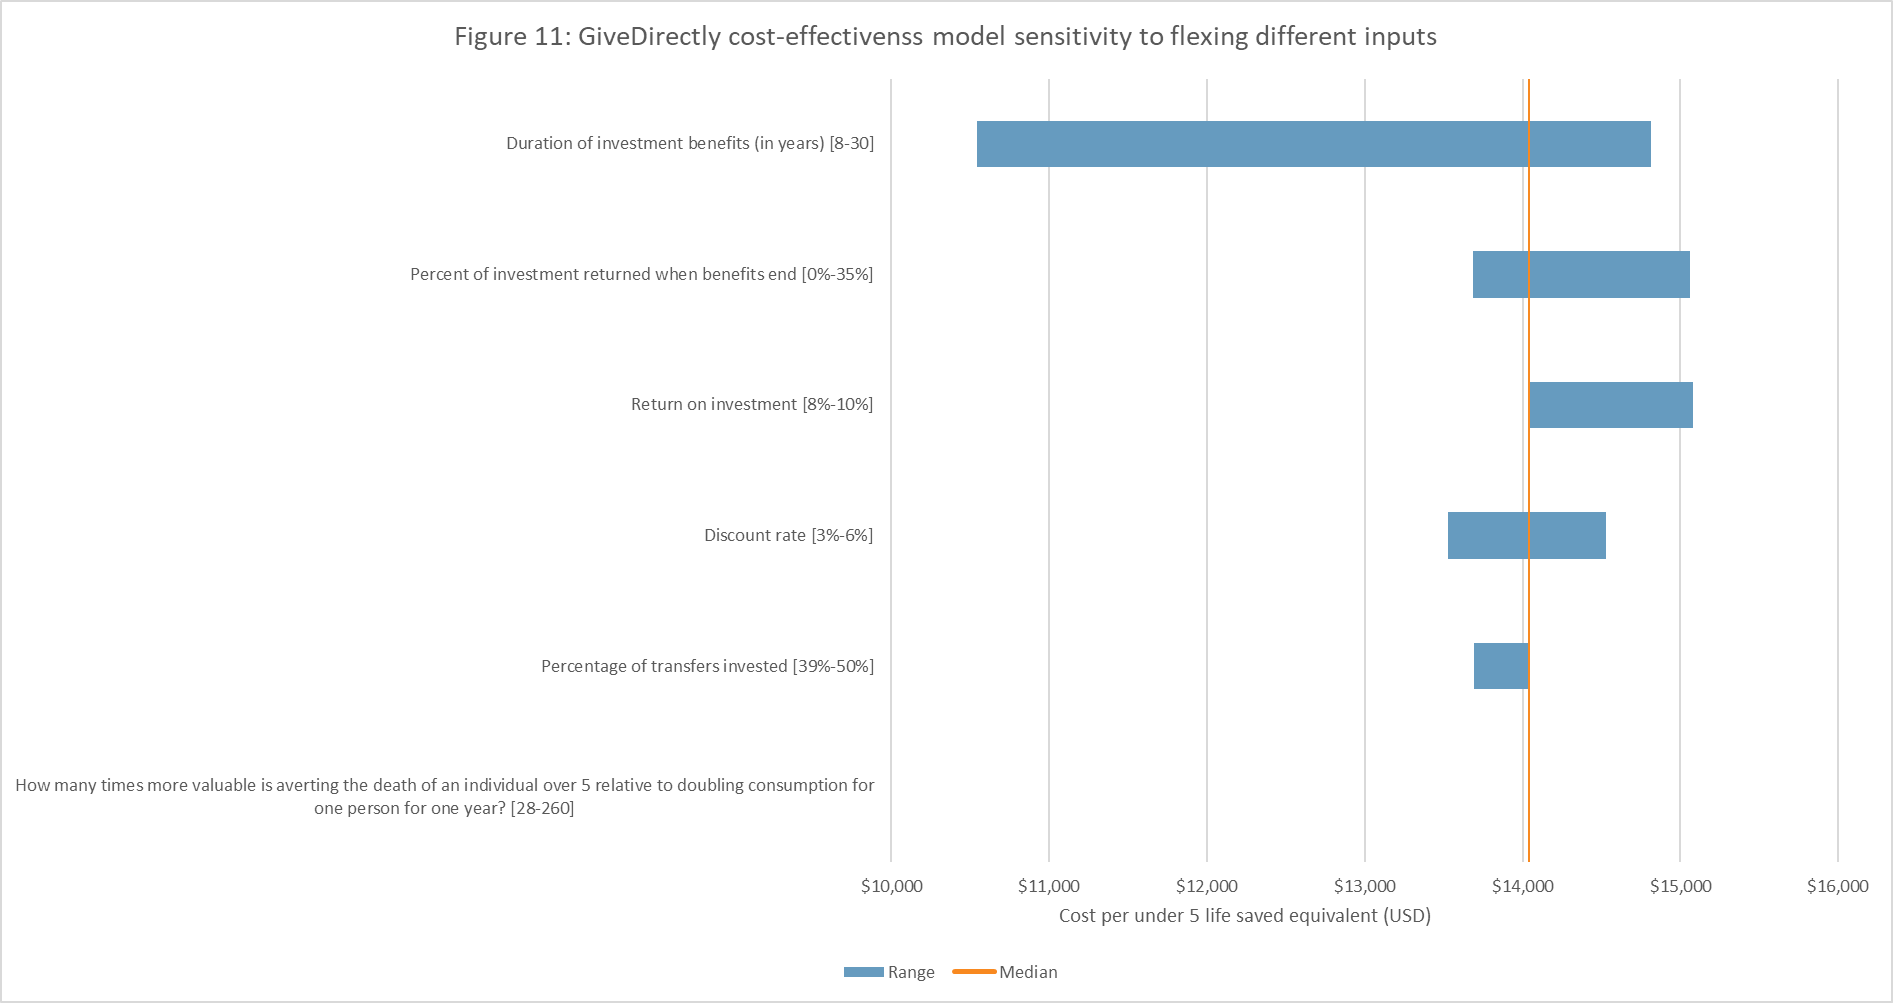
Appendix
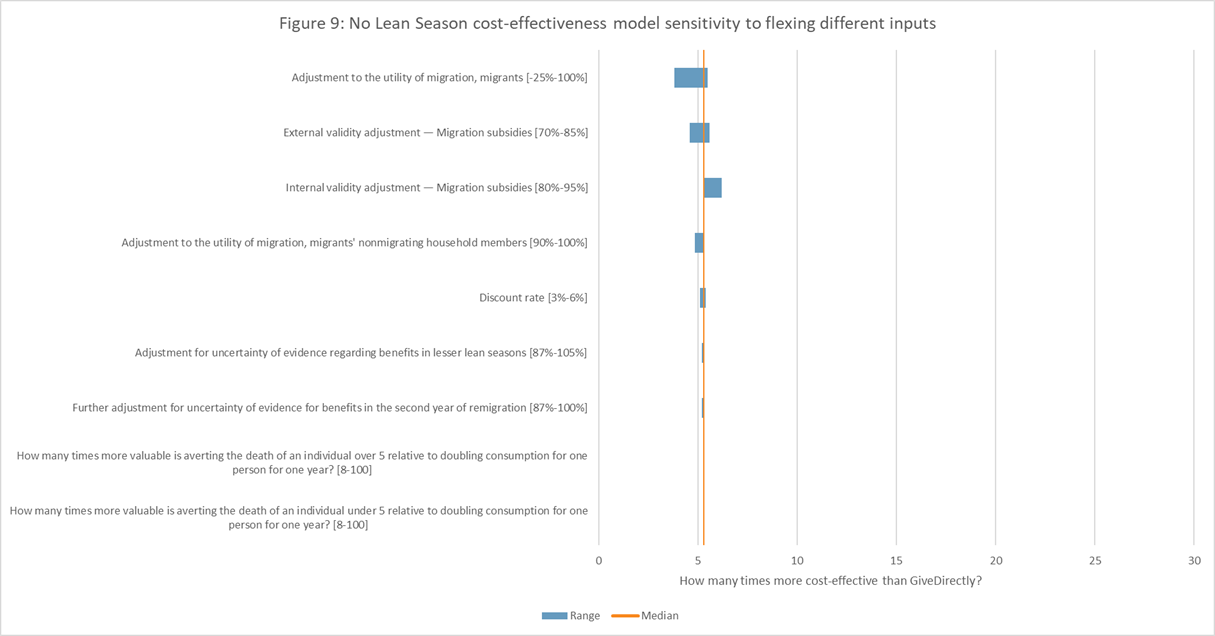
In this section, we present tornado charts for each of our top charities. You can see more detailed descriptions of how to interpret these parameters here, or in the cell notes of our cost-effectiveness analysis.

Notes
| ↑1 | Differences in their methodologies have been discussed, with older figures, in a 2012 blog post by the Center for Global Development. |
|---|---|
| ↑2 | Each contributor to our cost-effectiveness analysis inputs their own values for particularly uncertain parameters. We use the median of contributors’ final cost-effectiveness results for our headline cost-effectiveness figures. To simplify the sensitivity analysis, we used the median of contributors’ parameter inputs to form a central cost-effectiveness estimate for each charity. The results below therefore differ slightly from our headline cost-effectiveness figures. To determine how sensitive the model is to each parameter, we flexed each parameter between the highest and lowest contributors’ inputs, while holding all other parameters constant. For more details, see our sensitivity analysis spreadsheet. |
| ↑3 | You can see each of our contributors’ inputs for moral weights, and other uncertain parameters, on the Moral weights and Parameters tabs of our cost-effectiveness analysis. This year, contributors were also asked to provide a brief justification for their inputs in the cell notes. |
| ↑4 | You can read more about how contributors settled on the values they used for this parameter in the cell notes in row 16 of the Parameters sheet of our November 2017 cost-effectiveness model. |
| ↑5 | The sensitivity of other deworming charities is largely dependent on the same parameters. Charts are presented in the Appendix. |
Comments
Am I the only one who first read that “one year’s income vs a child’s life” chart as being percentual (despite it being explained in the previous paragraph)? I was quite baffled as it seemed they were valuing a child’s life at most at the value of one year of doubled income..
Comments are closed.