Added October 2022: From 2020 to 2022 we used the name “Maximum Impact Fund” to refer to the fund used to support the highest-priority funding needs among our top charities each quarter. In September 2022, we changed the name of this fund to the “Top Charities Fund” to better describe what opportunities this fund supports; more information here.
2020 was another year of tremendous growth. GiveWell donors contributed over $240 million to our recommended charities (our “2020 money moved”), a 60% increase from the approximately $150 million we directed in 2019. This is part of an exciting, long-term trend. Just a decade ago, in 2010, GiveWell’s total money moved was $1.5 million.[1]
We believe these donations will save tens of thousands of lives and benefit many others. This incredible impact would not be possible without the continued support and generosity of our donors. While our research enables us to identify and recommend highly cost-effective giving opportunities, our donors are responsible for turning those recommendations into real change for some of the poorest individuals in the world.
This post lays out highlights from our final 2020 money moved report and shares more details about how donors gave to GiveWell’s recommended charities in 2020.[2]
Summary of influence: In 2020, GiveWell influenced charitable giving in several ways. The following table summarizes our understanding of this influence.
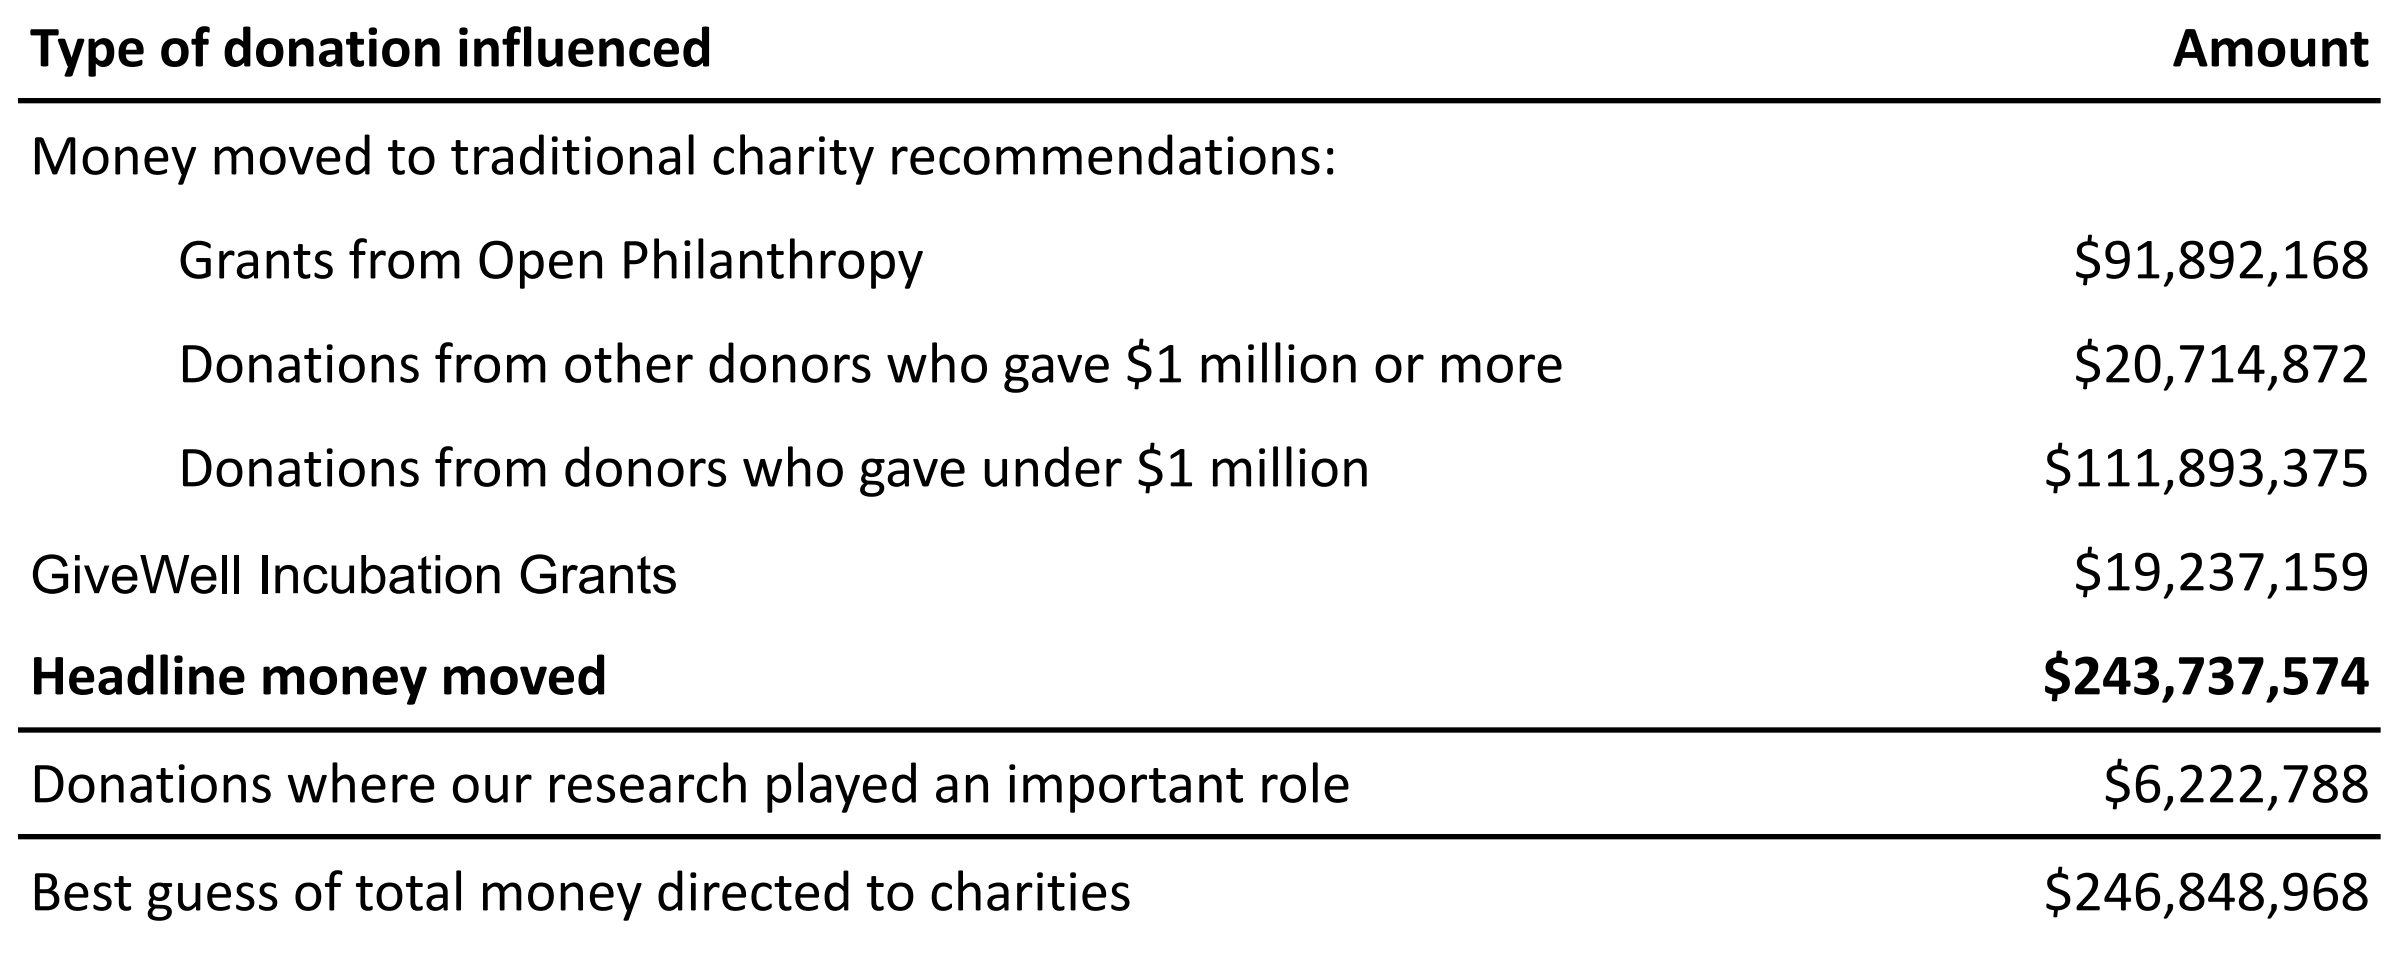
Headline money moved: In 2020, we confidently tracked $244 million in money moved to our recommended charities, and via our GiveWell Incubation Grants program. This amount, which we call “headline money moved,” only counts donations that we are confident were influenced by our recommendations. This includes the grants we make through the Maximum Impact Fund. See Appendix 1 of our 2020 metrics report for additional details on how we calculate our money moved.
We also estimate that we are responsible for an additional $3 million in donations, but we are unable to attribute these donations directly to GiveWell. Because we are more uncertain about this influence, we do not include this amount in our “headline money moved” figure but include it in our “best guess of total money directed to charities” figure. [3]
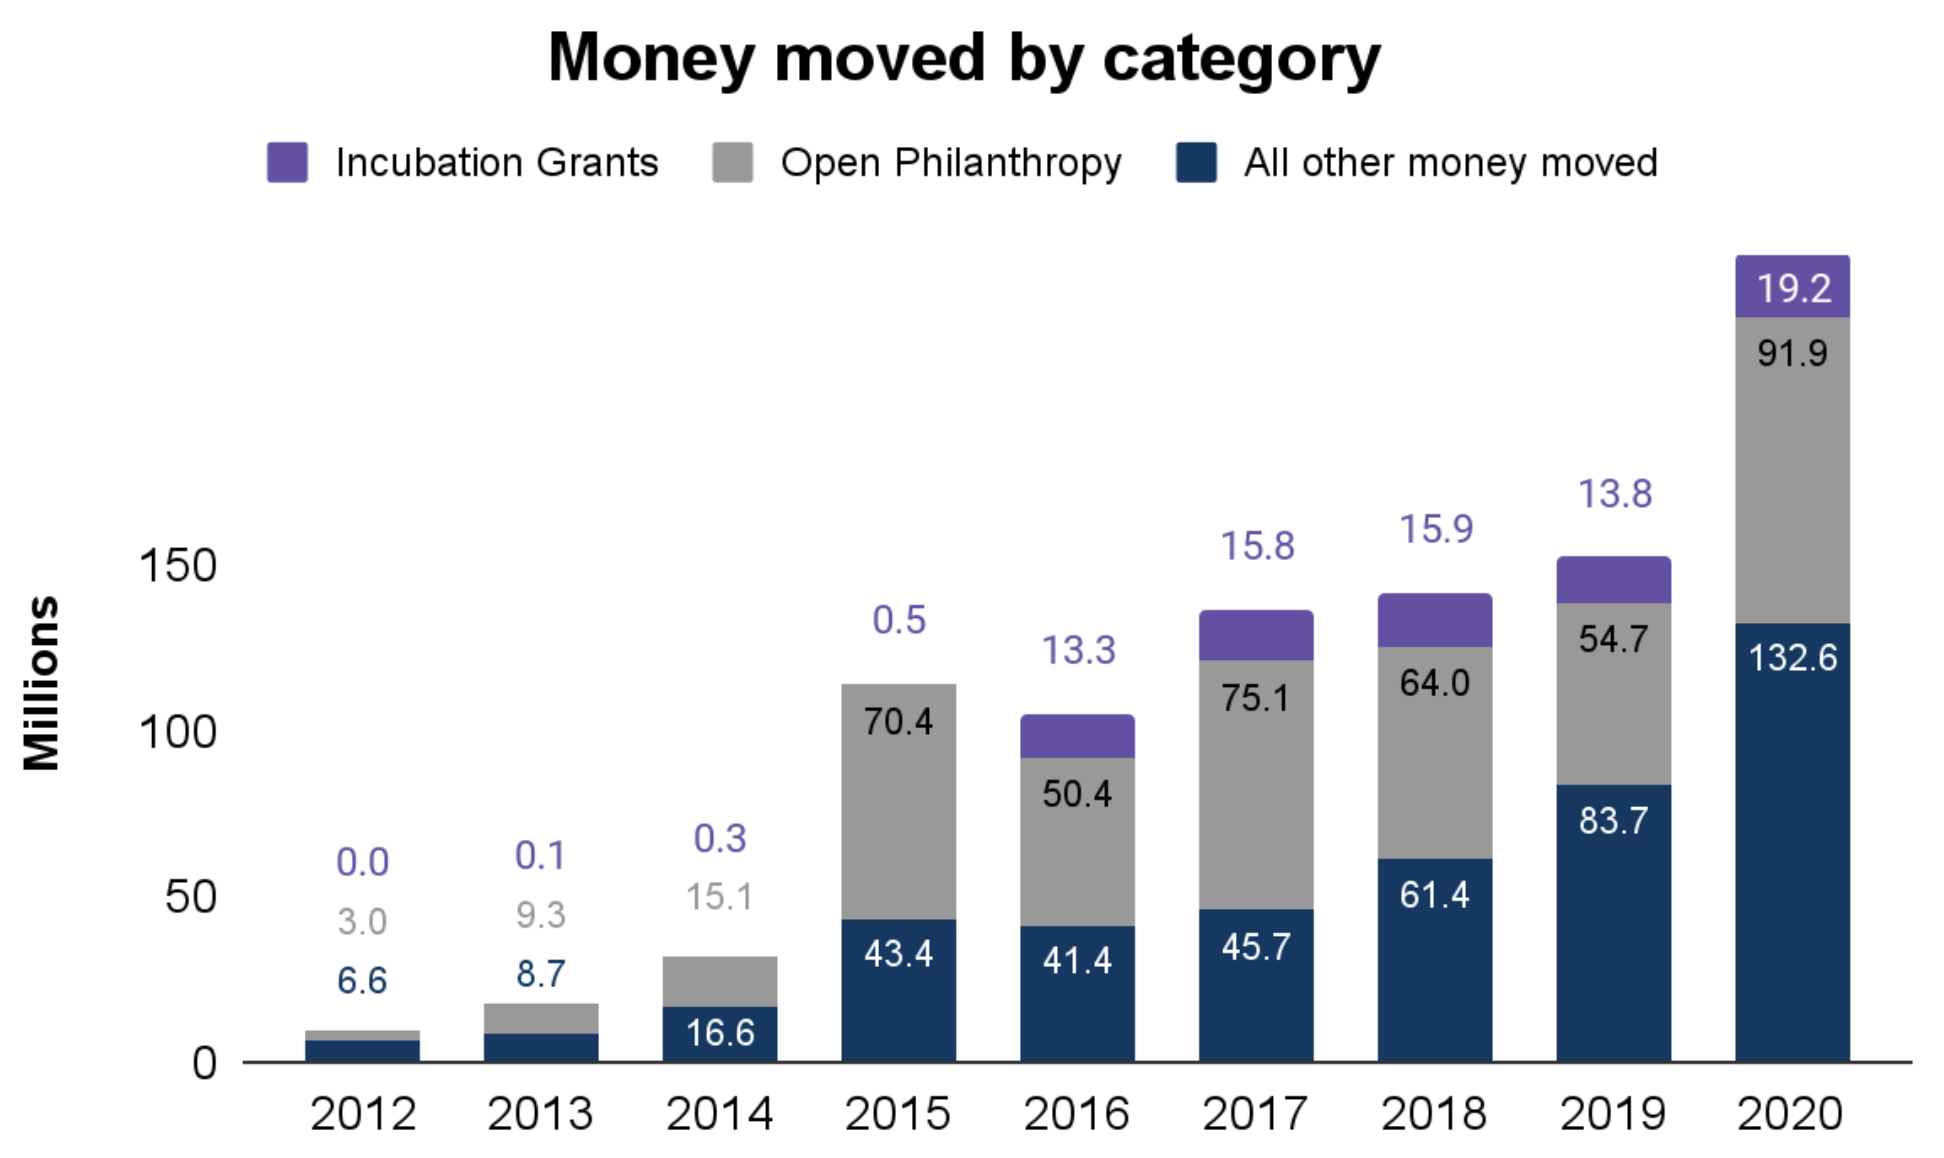
The chart below shows the breakdown of our headline money moved into the following categories: grants that Open Philanthropy made to our recommended charities, donations from other donors to our recommended charities, and Incubation Grants. Please note that Open Philanthropy support (marked in gray) does not include funding it provided for GiveWell Incubation Grants, which are shown separately in purple. [4]
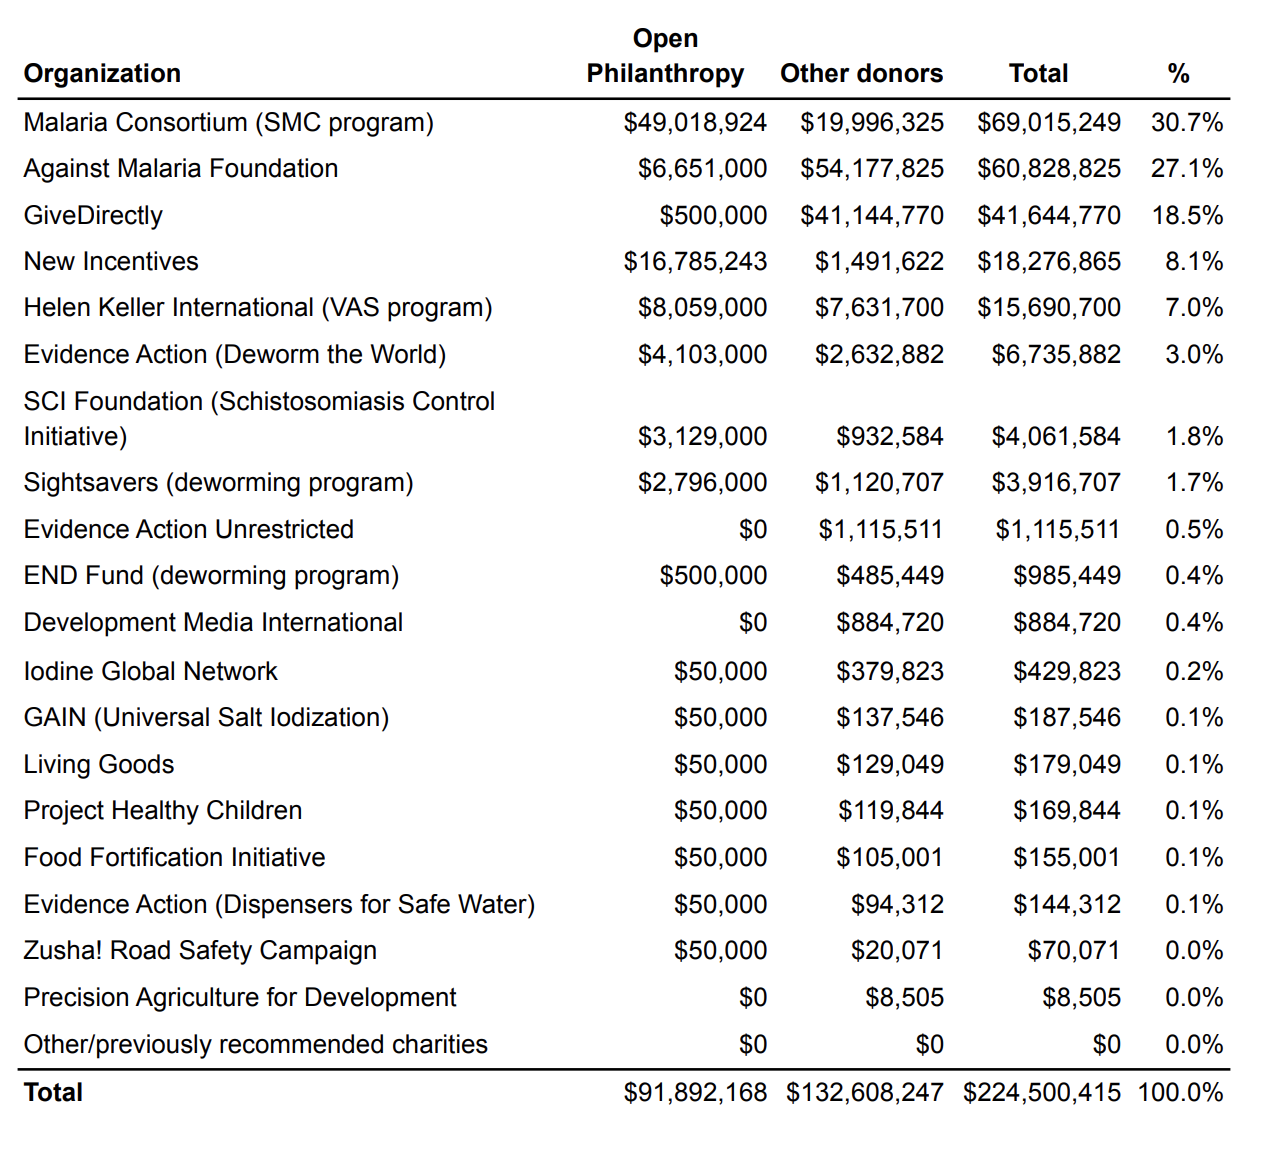
Money moved by charity (excluding Incubation Grants): Our nine top charities received the majority of our money moved. Our nine standout charities received a total of $2.2 million. Note that as of October 2021, we have discontinued the standout charity designation. [5]
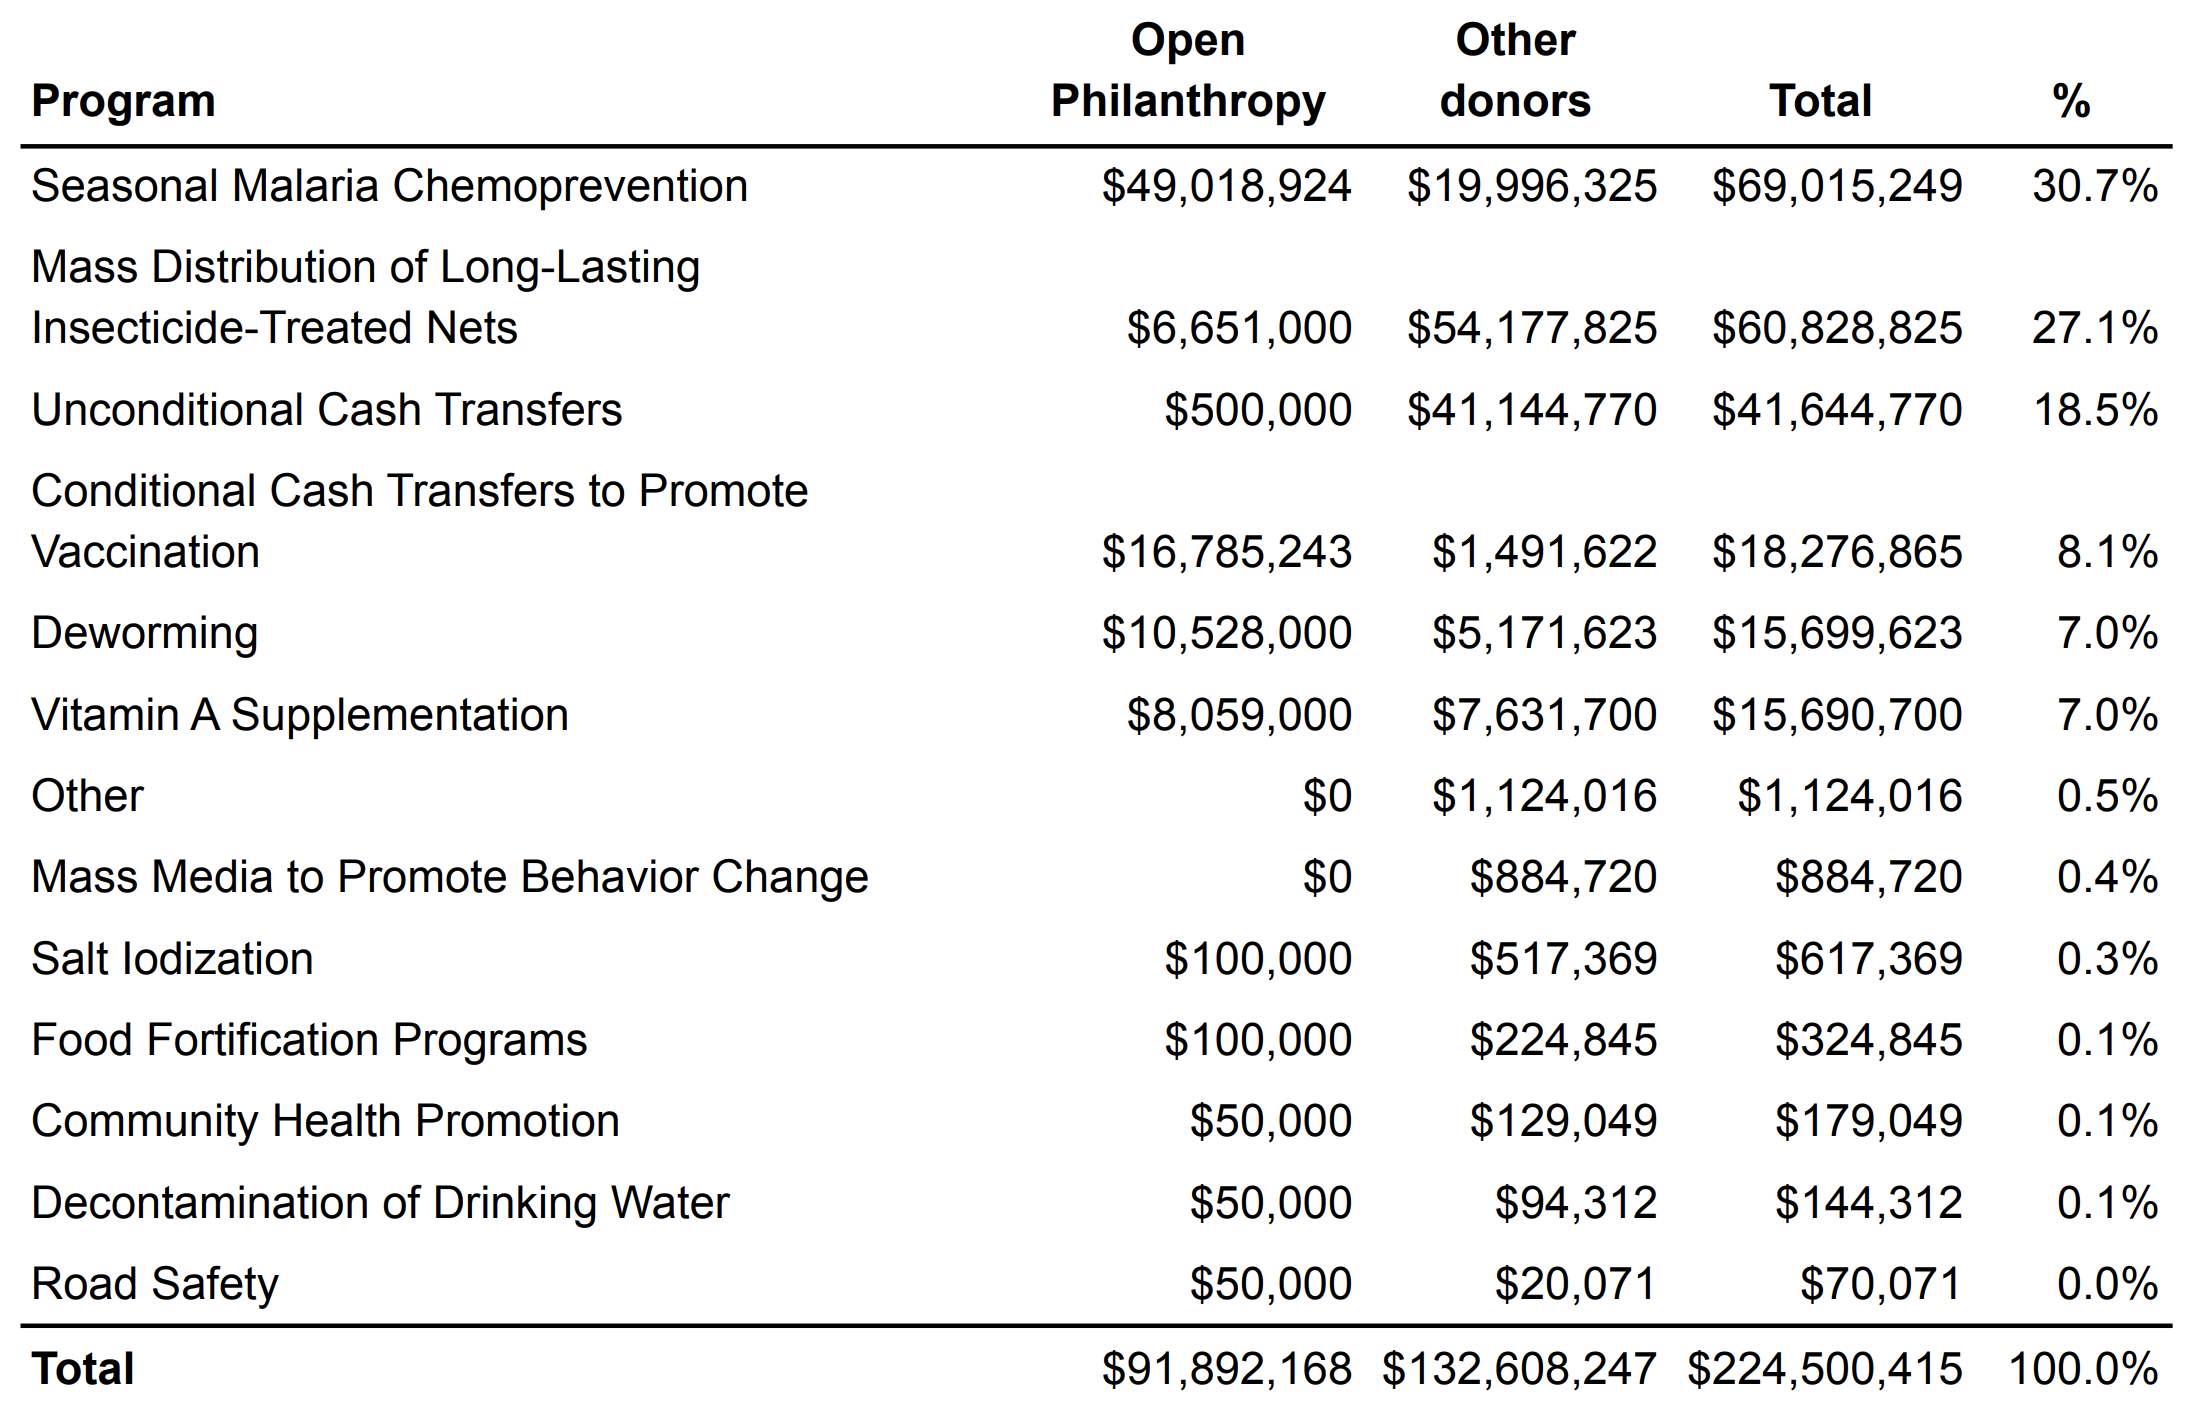
Money moved by program (excluding Incubation Grants): Our recommended charities implement a variety of health and poverty alleviation programs. But some charities work on the same type of program. For example, we recommend four charities for their programs that support treatments for parasitic worm infections (deworming programs), and two charities for their programs to prevent malaria (Malaria Consortium’s seasonal malaria chemoprevention program and the Against Malaria Foundation). Here, we look at the breakdown of money moved by program type.
The majority of our money moved, including donations to our Maximum Impact Fund, was directed to malaria prevention programs—followed by unconditional cash transfers, conditional cash transfers to promote vaccination, deworming, and vitamin A supplementation. Other programs each received less than 1% of our total money moved.
Money moved by size of donor: We also analyze our money moved by the amount that different donors give, which we categorize into six different “size buckets” (see the chart below, which excludes funding from Open Philanthropy).
A caveat: Our analysis of money moved by donor size is incomplete because for approximately 39% of donations (excluding Open Philanthropy), we do not have data disaggregated by individual donor. Among the donations we can attribute to individual donors, the amount of money given increased across all donor size categories compared to 2019. Details are available in the full report.
_2020.png)
_2020.png)
Donations supporting GiveWell’s operations: GiveWell raised $43.6 million in unrestricted funding in 2020, compared to $19 million in 2019. Donors who gave over $100,000, including Open Philanthropy, contributed around 84% of GiveWell’s unrestricted funding in 2020. GiveWell’s total operating expenses in 2020 were $8.5 million.
We have only retained a portion of our unrestricted 2020 revenue for operating costs, and will be reallocating the remainder to discretionary grantmaking. [6]
For more detail, see our full metrics report (PDF).
References
Footnotes for this post may be found here.