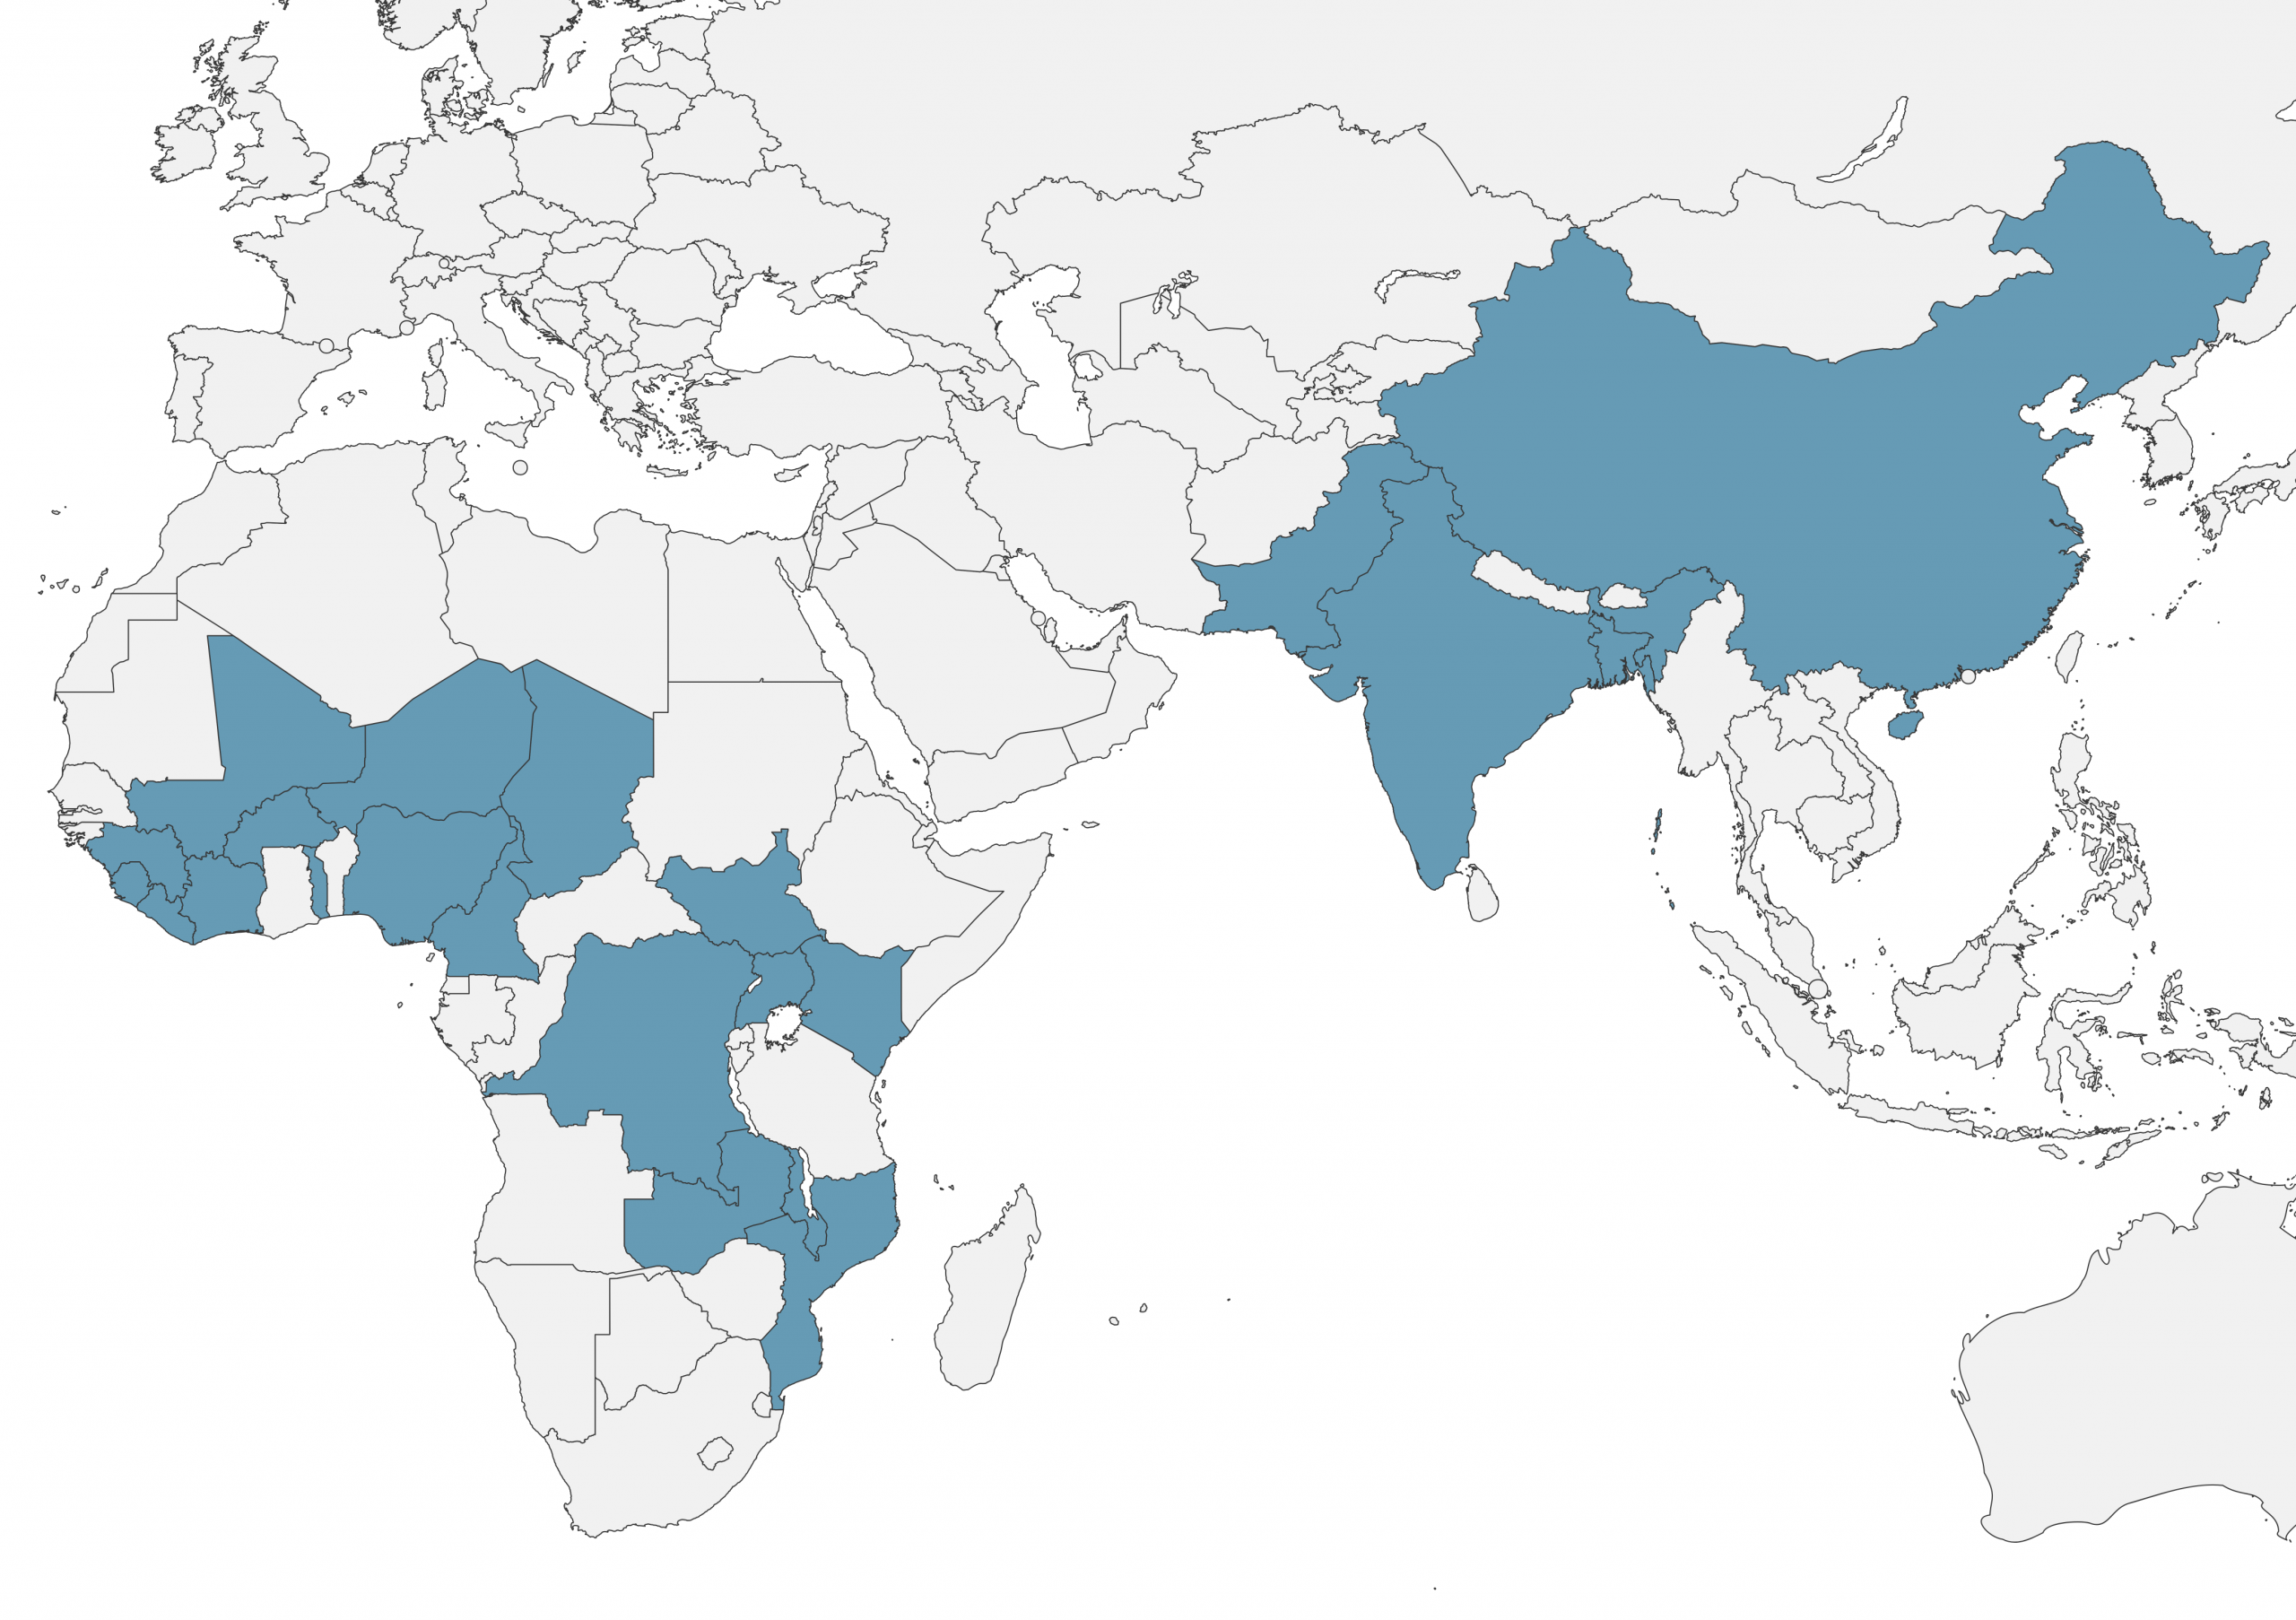
Thanks to the generosity of more than 30,000 donors, GiveWell raised $415 million and directed $397 million to cost-effective programs in metrics year 2024 (February 2024 to January 2025).1 GiveWell’s metrics year runs from February 1 through January 31. Our metrics report is typically published at least six months after the close of the metrics year because we need to collect data on donations we influence from third parties and then cross-check that data to ensure we aren’t double-counting any funds. We approved 55 grants to 34 organizations working in 22 countries.2The countries include Bangladesh, Burkina Faso, Cameroon, Chad, China, Côte d’Ivoire, DRC, Guinea, India, Kenya, Liberia, Malawi, Mali, Mozambique, Niger, Nigeria, Pakistan, Sierra Leone, South Sudan, Togo, Uganda, and Zambia. Some 2024 grants were not country specific. We estimate that the programs supported by these grants will help around 34 million people who would not otherwise have been reached and will save an additional 74,000 lives.3The calculations for these impact estimates cover only the 17 grants in 2024 focused on reducing mortality, and exclude the impacts from our other 38 grants.
We’re incredibly grateful to our donors for the trust they place in our research and for their partnership in trying to do the most good we can together. See our full 2024 metrics report for more details behind the money we raised, the funds we directed, operational expenses, donor metrics, and the impact we had last year.
Funds raised
Donations increased from 2023 to 2024, with total funds raised of around $415 million in 2024 compared to around $355 million in 2023.
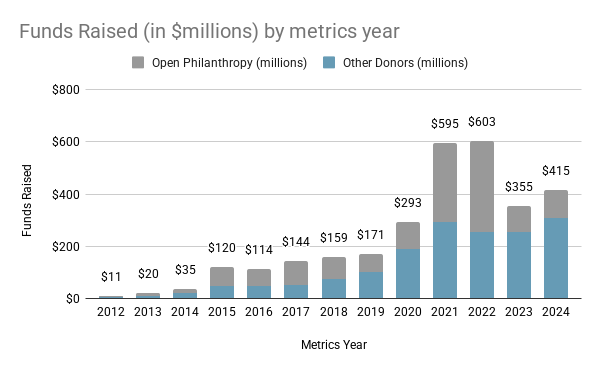
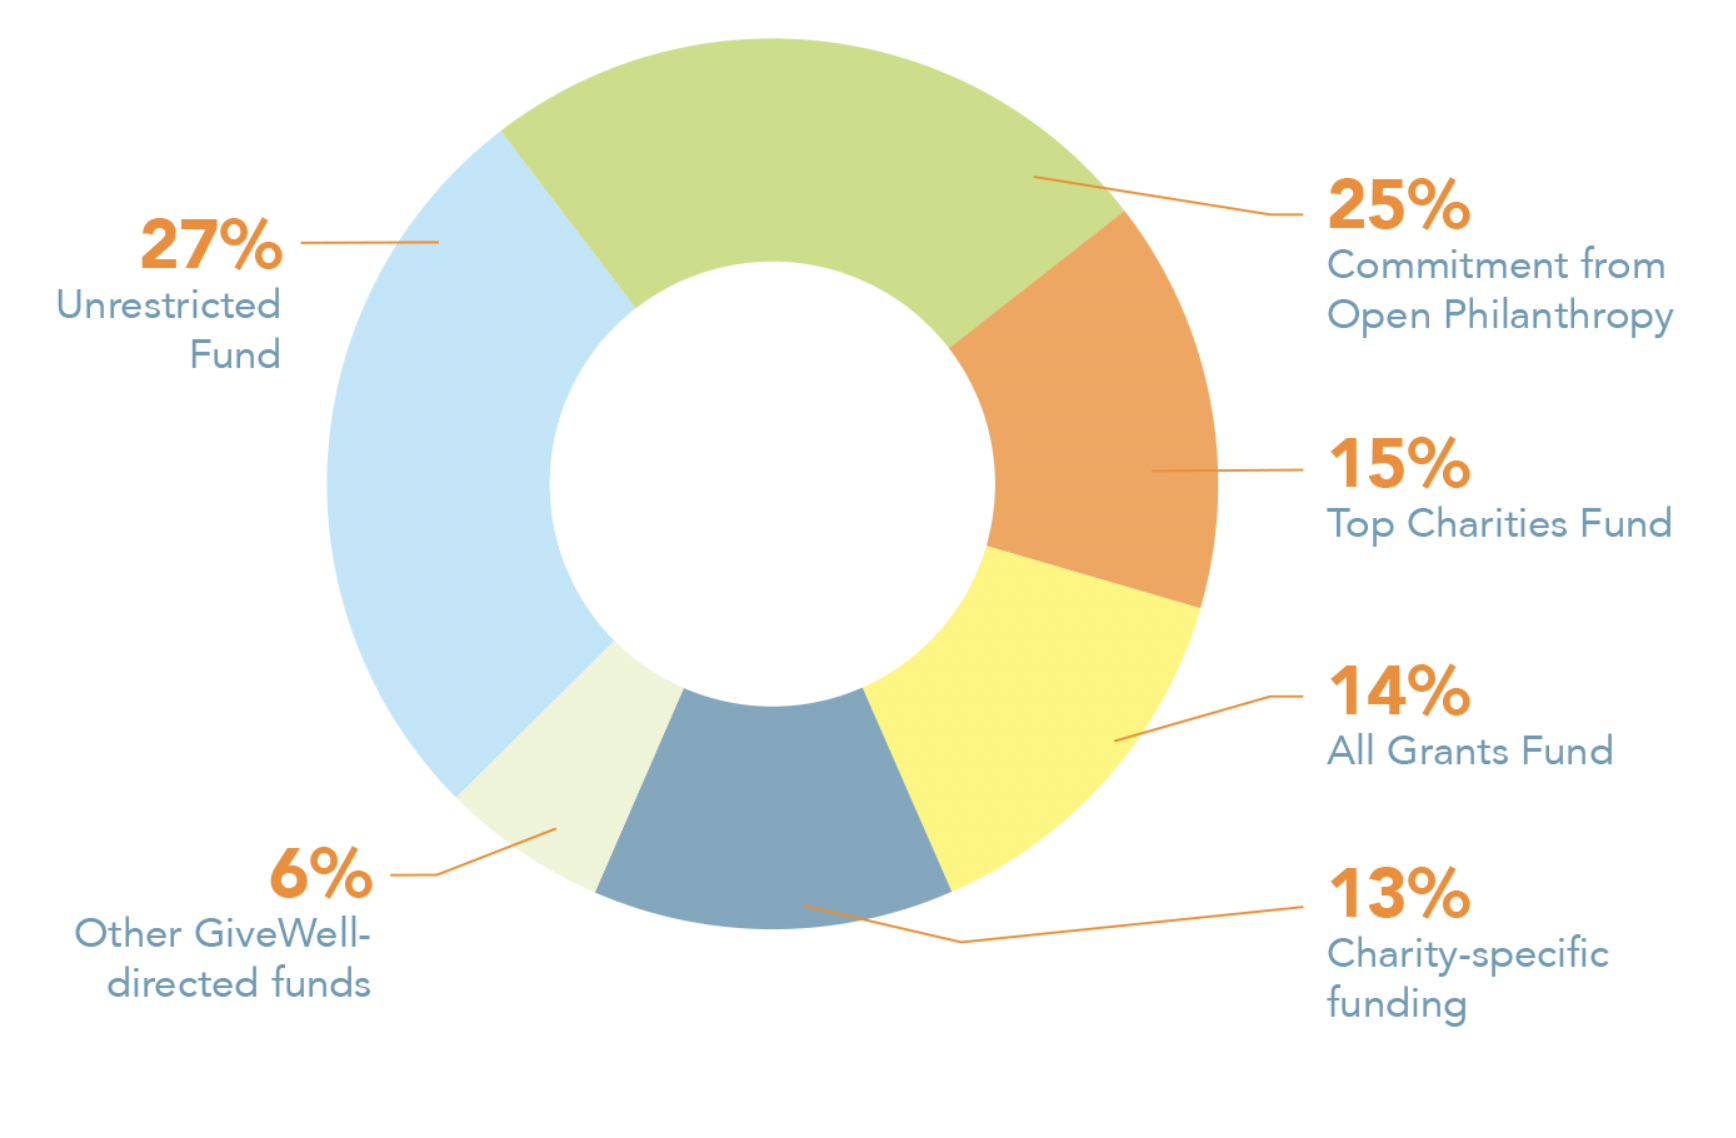
Our funds raised include $64 million in donations to our Top Charities Fund, $59 million to our All Grants Fund, $111 million to our Unrestricted Fund, a commitment of $100 million from Open Philanthropy, and other donations to support cost-effective global health and development programs. While we raised more money in 2024 than 2023, we raised less than in the previous two years due to high funding from Open Philanthropy during that time.4Note that the figures in the chart for 2020 and earlier refer to “money moved,” which we are no longer reporting. Though similar, these two metrics are not directly comparable.
Most donors who give via GiveWell rely on GiveWell to allocate their donation rather than choosing to restrict their donation to a particular organization. In 2024, 87% of the donations we raised fit into this category, compared to 90% in 2023, 91% in 2022, and 86% in 2021.5These funds include donations to the Top Charities Fund, donations to the All Grants Fund, donations to our Unrestricted Fund, which can be allocated to any GiveWell priority, including grantmaking and our own operating expenses, and grants we recommend that other funders make. This category excludes donations to individual Top Charities (either through us or directly to the organization) unless the donation is the result of a specific request we made to a donor.
Funds directed
In 2024, we directed $397 million to high-impact programs and organizations.6This includes both grantmaking and donations made to our Top Charities on the basis of our recommendation. Some GiveWell grants are conditional on specific criteria, such as organizations signing agreements with local governments or achieving certain benchmarks. If some of those conditions are not met, the total amount disbursed to organizations may be less than $397 million. In addition, some grants provide funding for more than one year; we count the total grant amount as funds directed in the year the grant is committed.
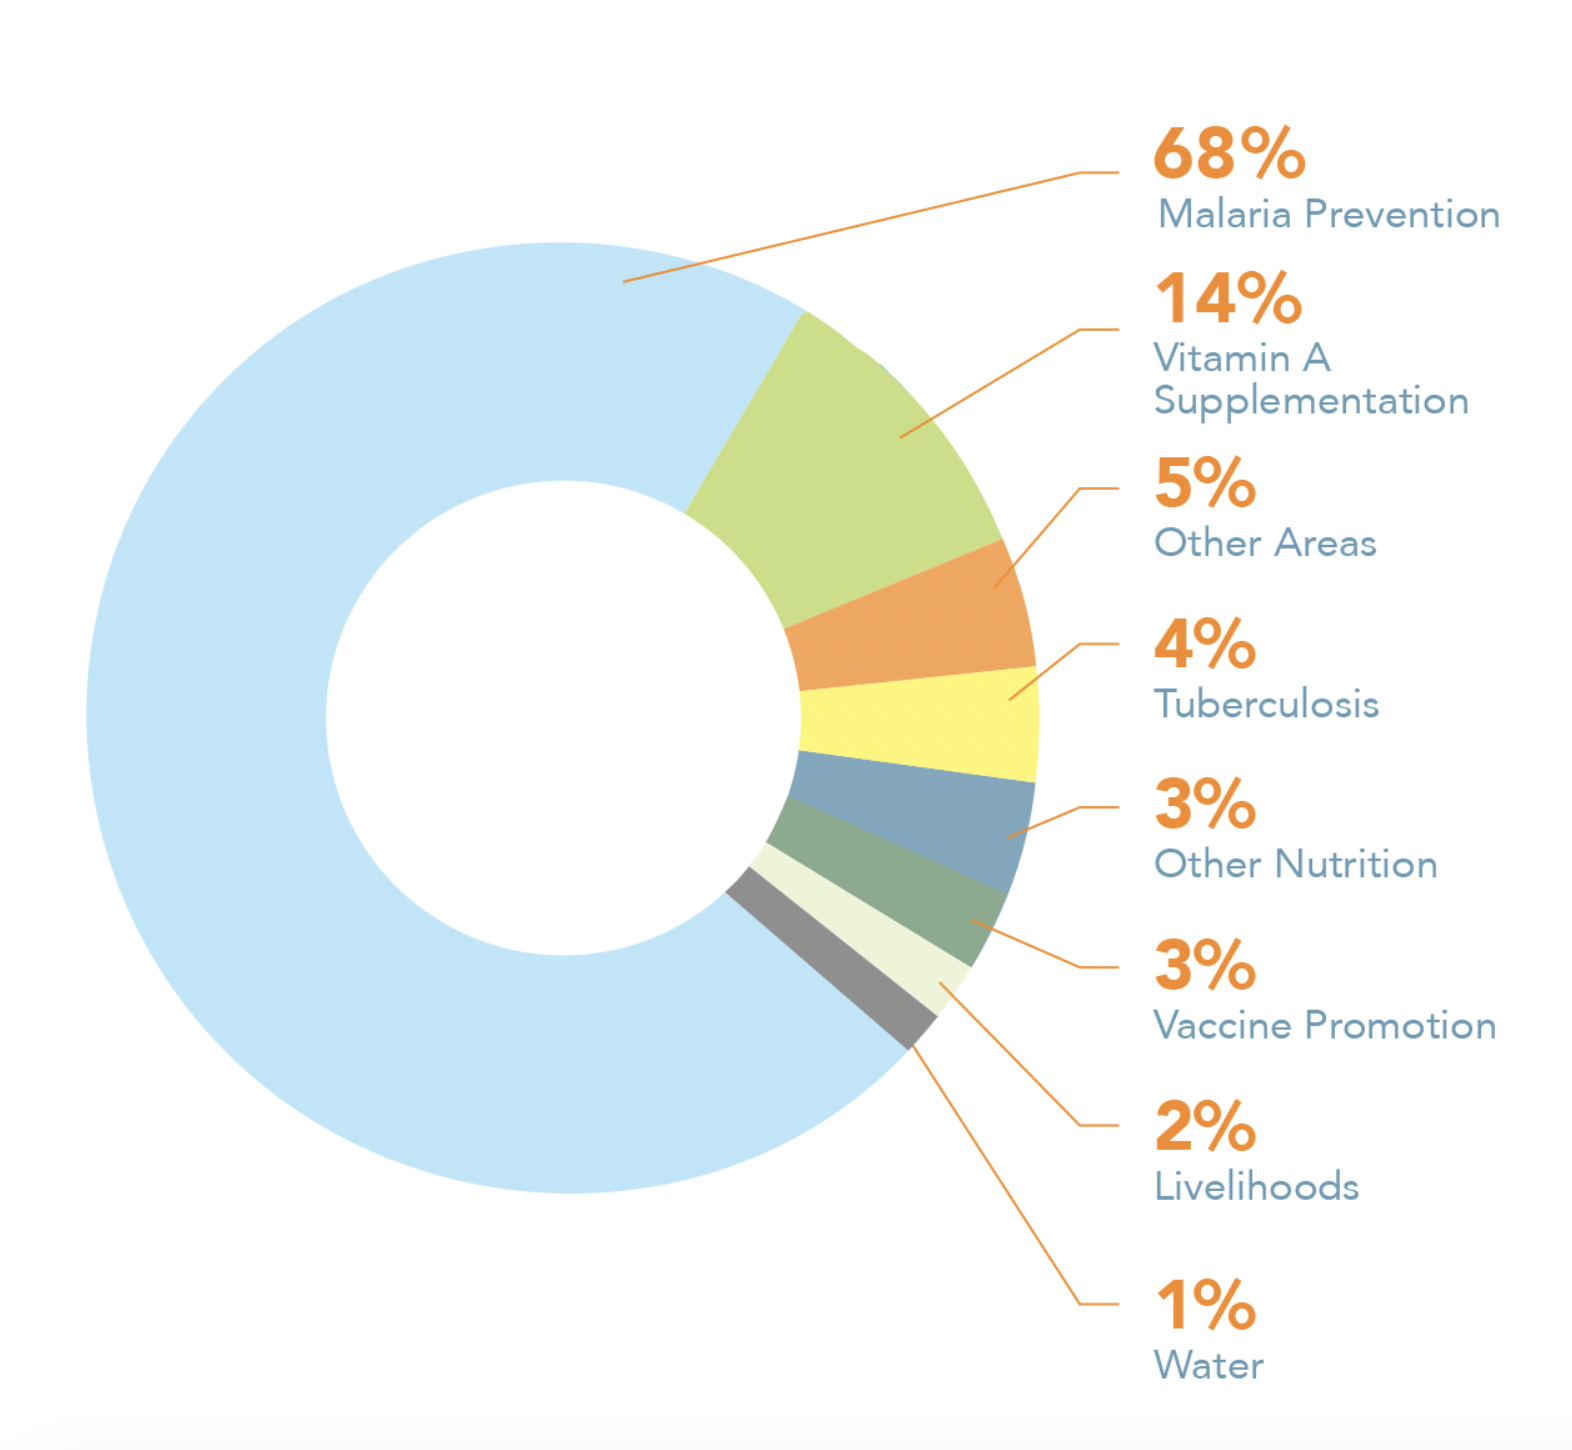
Of the $397 million we directed to organizations in 2024, 76% went to our four Top Charities, with $150 million (50% of the total directed to Top Charities) going to the Against Malaria Foundation for insecticide-treated nets to prevent malaria, $87 million (28%) to Malaria Consortium for its seasonal malaria chemoprevention program, $54 million (18%) to Helen Keller Intl for its vitamin A supplementation program, and around $12 million (4%) to New Incentives for its program of conditional cash transfers to increase vaccinations.
Around $95 million was directed to organizations and programs other than our current Top Charities. This includes grants to incubate newer programs, promote policy change, fund relevant scoping and research, or support other potentially high-impact, cost-effective initiatives.
Below is a list of organizations and programs GiveWell supported in 2024, organized by funding amount. The amounts include both funding we allocated and funding designated by donors for specific organizations.
| Organization and Program | Total |
|---|---|
| Against Malaria Foundation – insecticide-treated nets (Top Charity) | $149,670,66 |
| Malaria Consortium – seasonal malaria chemoprevention (Top Charity) | $86,955,952 |
| Helen Keller Intl – vitamin A supplementation (Top Charity) | $54,187,611 |
| PATH – malaria vaccines | $17,367,272 |
| Clinton Health Access Initiative (CHAI) – tuberculosis contact management | $15,092,329 |
| Malaria Consortium – insecticide-treated nets | $14,861,911 |
| New Incentives – conditional cash transfers for vaccinations (Top Charity) | $11,522,024 |
| Nutrition International – rice fortification | $5,470,534 |
| CHAI – organizational development | $5,104,824 |
| Taimaka – malnutrition treatment | $4,787,985 |
| London School of Health & Tropical Medicine – eyeglasses RCT | $4,786,813 |
| New Incentives – oral rehydration solution | $4,759,596 |
| Evidence Action – deworming | $4,371,604 |
| Nutrition International – vitamin A supplementation | $3,133,480 |
| ALIMA – malnutrition treatment | $2,000,000 |
| Ansh – kangaroo care | $1,976,578 |
| Dimagi – CommCare Connect | $1,320,542 |
| Y-RISE – RCT of water entrepreneurship program | $1,299,147 |
| Evidence Action – syphilis screening and treatment | $1,214,089 |
| Resolve to Save Lives – scoping for dietary salt modification | $726,889 |
| Wageningen University – vaccine outreach RCT | $676,857 |
| MDGH – WHO prequalification for moxidectin | $637,549 |
| IPA and University of Michigan – Raising the Village RCT | $542,110 |
| University of Oxford – GiveDirectly RCT | $491,700 |
| Uduma – in-line chlorination pilot | $480,501 |
| J-PAL Africa – scoping for chlorine vouchers | $472,362 |
| Our World in Data – unrestricted support | $400,000 |
| University of Chicago – study of conditional cash transfers | $369,075 |
| University of California, Berkeley – study of cash transfers | $338,897 |
| Mangrove Water – in-line chlorination | $325,508 |
| IDinsight – beneficiary preferences research/pilots | $299,083 |
| Evidence Action – iron and folic acid supplementation | $297,176 |
| Center for Global Development – research on funding opportunities | $197,000 |
| University of Oxford – iron bioavailability study | $187,330 |
| 3ie – scoping for preschool RCT follow-up | $169,691 |
| International Rescue Committee – scoping for vaccination | $150,000 |
| IRD Global – breastfeeding reminders pilot | $100,000 |
| IDinsight – review of AMF’s monitoring | $94,500 |
| Zipline – scoping for use of drones for vaccination | $60,082 |
| Urban Institute – history of philanthropy | $50,000 |
| Spark Microgrants – RCT workshop | $20,000 |
Notes
| ↑1 | GiveWell’s metrics year runs from February 1 through January 31. Our metrics report is typically published at least six months after the close of the metrics year because we need to collect data on donations we influence from third parties and then cross-check that data to ensure we aren’t double-counting any funds. |
|---|---|
| ↑2 | The countries include Bangladesh, Burkina Faso, Cameroon, Chad, China, Côte d’Ivoire, DRC, Guinea, India, Kenya, Liberia, Malawi, Mali, Mozambique, Niger, Nigeria, Pakistan, Sierra Leone, South Sudan, Togo, Uganda, and Zambia. Some 2024 grants were not country specific. |
| ↑3 | The calculations for these impact estimates cover only the 17 grants in 2024 focused on reducing mortality, and exclude the impacts from our other 38 grants. |
| ↑4 | Note that the figures in the chart for 2020 and earlier refer to “money moved,” which we are no longer reporting. Though similar, these two metrics are not directly comparable. |
| ↑5 | These funds include donations to the Top Charities Fund, donations to the All Grants Fund, donations to our Unrestricted Fund, which can be allocated to any GiveWell priority, including grantmaking and our own operating expenses, and grants we recommend that other funders make. This category excludes donations to individual Top Charities (either through us or directly to the organization) unless the donation is the result of a specific request we made to a donor. |
| ↑6 | This includes both grantmaking and donations made to our Top Charities on the basis of our recommendation. Some GiveWell grants are conditional on specific criteria, such as organizations signing agreements with local governments or achieving certain benchmarks. If some of those conditions are not met, the total amount disbursed to organizations may be less than $397 million. In addition, some grants provide funding for more than one year; we count the total grant amount as funds directed in the year the grant is committed. |
Comments
Great work everyone! Proud to be a part of this 🙂
I watched a documentary about malaria community health workers.
Lifelines – The End Game, Al Jazeera English, 2014
https://www.youtube.com/watch?v=kmrvDrGaU_o&list=PLivkn97ukHvOkLlaNvF8eRivVIAyoRvzx
I was touched by the commitment of community health workers. I am far richer than one of those nurses. Yet one of those nurses worked much harder than me to save a child’s life. I’d like to quantify an estimate of this relative generosity.
I’d like to come up with a simple “generosity metric” that captures how much of someone’s income is effectively going into saving lives. One natural way is: income divided by number of lives saved (i.e., “income per life saved”). For example, if someone makes $1 million and donates $20,000 which saves 2 lives, that’s about $500,000 of income per life saved. Or, if someone makes $100,000 and donates $10,000 and that donation saves 1 life, then that person is “spending” (in effect) $100,000 of their income per life saved.
Now I want to apply a similar generosity‑style metric to a community health worker program (for malaria) in a global-health context. To do that, I need realistic numbers:
– Suppose 4 million community health workers (CHWs) globally dedicated to malaria.
– Suppose the annual malaria‑specific budget is $4 billion, and that this program averts 1 million deaths.
– That naive example would correspond to a cost of about $4,000 per life saved (i.e., $4B / 1 M lives).
I am familiar with GiveWell’s cost-effectiveness spreadsheets. I recall a recent estimate was about 8K USD per marginal life saved.
Does a researcher at GiveWell know the stats of an example scenario to estimate the income per life saved of a community health worker for any of the Top Charities recommended by GiveWell?
Hi Ethan,
Thanks for your question! Unfortunately, we don’t have an easy way to calculate income per life saved for community health workers (CHWs). We do have some information about CHW salaries: Malaria Consortium told us that CHWs supporting seasonal malaria chemoprevention are paid about $5 to $7 per day, though this amount varies by country. Hope that helps!
Comments are closed.