A previous post shared Holden’s general thoughts from last year’s several-month staff trip to India. This post shares my thoughts; the next will share Natalie’s.
Site visits are short and it’s impossible get a full picture of an organization, its work, and its likely impact. But, little things about how programs look on the ground and how they compare to what the marketing materials say can be telling.
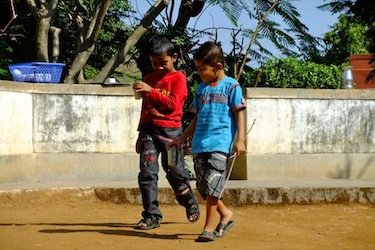
- “We give shoes to poor children.” I visited a soccer practice for kids. It had rained the day before I went, so the field was soaked. Because the field was wet, the kids were allowed to play barefoot, the coach told me. The organization provides the kids with shoes, which the kids must wear. The coach said that the kids were happy because they prefer to play barefoot, but the organization only lets them do so when it’s wet out. Later that day, I went back to the organization’s office and spoke to the development director. As part of his presentation, he noted that the organization provides children with shoes, and the kids love coming to the field and putting on their shoes.
- “We teach English.” English appears to be an extremely valuable skill, allowing speakers to obtain relatively high paying jobs such as working in a call center. One organization we visited taught English classes to teenagers, which seems like a very promising program to run in Mumbai. But, after visiting the classroom, we wondered how effective the class actually was. In the class we visited, the teacher stood at the front of the class writing English sentences on the board and the students copied down the sentences into their notebooks. When we were there, we saw approximately 5 sentences on the board, one of which was “We shall make your tongue right again.”
- “We teach computer classes.” Several organizations we visited offered computer classes for kids. The classes were held in rooms with a few computers. A couple of times, I clicked on the Start menu of computers not currently in use to take a look at recently accessed documents. I wanted to know what types of work the kids did. When I loaded Microsoft Word or Microsoft Excel – two of the programs the organization said they used in their classes – it was clear that this was the first time these programs had been loaded. They asked me to register my version of Excel and enter a username.
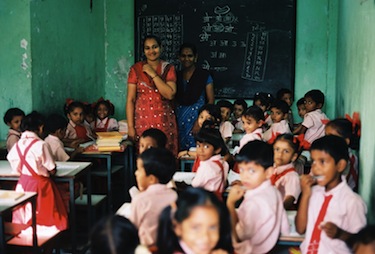
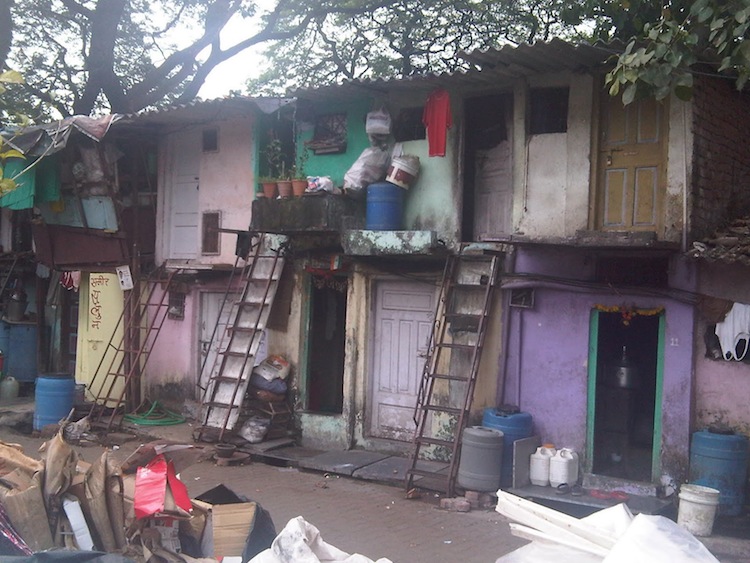
- “We educate children on health behaviors.” We visited an organization offering health classes for children. The topic of the session I attended was “healthy eating” and the teachers talked about not eating too much junk food which is high in calories. While it makes sense that a child should eat fruits and vegetables and not too much candy and fried food, it didn’t seem like the most pressing message for the children I saw. They were all frail, looked a lot younger than they were, and may have been malnourished. I felt like I was attending a class that would fit better at school in the United States than a classroom in a Mumbai slum.
 In Mumbai, we also had the chance to visit several organizations we had already reviewed on our website and get an on-the-ground perspective. I visited Mumbai’s TB Control Program, guided by a WHO consultant stationed in Mumbai. This wasn’t a visit, specifically, to the Stop TB Partnership, but because Stop TB supports government-run TB programs, this visit was to the type of program Stop TB supports. Each person I met with from the WHO consultant to the director of Mumbai’s TB Control Program to directors of hospitals and clinics were (a) aware of monitoring procedures, (b) answered all my questions about how they monitor, and (c) often showed me examples of documents and data as support.
For example, a major focus of TB control programs is making sure that patients maintain the 6-month drug regimen, taking all prescribed doses and don’t stop taking them early (which often happens after a couple months as symptoms begin to subside). When I visited a local TB treatment center, I asked them how they monitor patients to ensure that they take all doses. The treatment center director told his staff to go into the back room and bring back a patient’s box of drugs along with that patient’s paper records. My guide showed me how he would check this particular patient’s records. The treatment center keeps each patient’s box of pills, the patient’s treatment schedule, and all used pill wrappers. At any point, an auditor can come and check the box and the paperwork to make sure everything is in order.
Seeing the monitoring and data-collection operation up close – and the ease with which the people I met with discussed the data and issues associated with collecting it – gave me more confidence in the monitoring data we rely in our report.