The GiveWell Blog

You can’t take the “repayment rate” at face value

We’ve written before about problems with the way a microfinance institution’s “repayment rate” is commonly cited. We’ve been surprised to find that most institutions do not report what most of us would think of as a “repayment rate,” i.e., the percentage of loans/dollars due that have been paid on time. Instead, they report proxies such as “portfolio at risk” that can (theoretically) be very different.

We now have an example of just how different they can be. ID-Ghana, a microfinance institution, has given us permission to post its application for funding from GiveWell. Page 2 discloses that “The write-off ratio has shot up lately because of the clean up that followed the phase out of our old loan products which proved to be inefficient and impactless,” yet the repayment ratio is reported as 99% (same paragraph). That’s because the definition of “repayment ratio” being used ignores loans that have been defaulted on and written off. Only “at-risk” (but still-on-the-books) loans lower this “repayment ratio.”

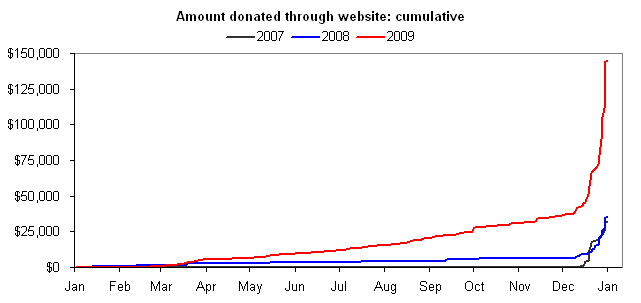
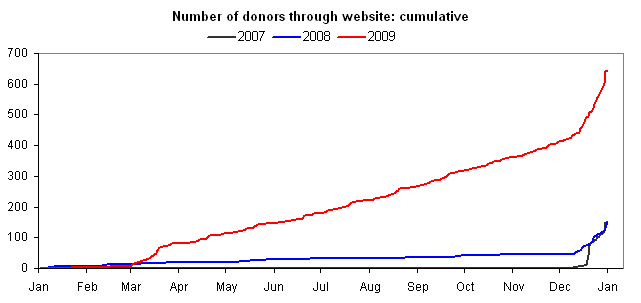
These charts show how drastic the disrepancy is, particularly from June 2009 on:

To be clear, we think ID-Ghana’s reporting is entirely consistent with standard reporting practices. To a large degree, that’s what worries us. By industry standard reporting practices, a 99% “repayment ratio” can be consistent with a 30%+ default rate – and is in this case.

This is why we’ve insisted on requesting what we call the “real repayment rate”, defined as the percentage of loans that have been paid off on time divided by the percentage of loans that have come due over a given time period (“loans” here can refer to number of loans or dollars lent).

What has shocked us is how few microfinance institutions are able to provide the real repayment rate. In fact, all of the major U.S. microfinance institutions we’ve contacted (excluding FINCA, which declined to apply for funding at all) have explicitly told us that they cannot or will not provide real repayment rates for their partners.

We’ll be writing more about the Small Enterprise Foundation, the only institution that we’ve seen be fully clear about its repayment rate.

Is borrowing good for the borrowers?

Just because someone is repaying their loans doesn’t mean they’re benefiting from the loans.

We have given some conceptual/anecdotal support for this idea in the past, linking to David Roodman’s posts on possible “overlending” and comparing microloans to payday loans. Lately we’ve been investigating something a bit more concrete: how often, and why, do microfinance clients “drop out” of microlending programs?

The basic idea is that a client could repay a loan due to pressure (from their “lending group” or the microfinance institution), making sacrifices or borrowing from elsewhere (such as moneylenders) to do so. We would expect such clients to show up as “repayers” while not necessarily staying in the program for more loans.

Our observations (details and full sources below):

  • Dropout rates appear substantial, averaging 28% and often exceeding 40%, among institutions that publicly report them (via MixMarket).
  • Survey data on why clients drop out is limited, but what we’ve seen suggests that “graduation” (i.e., moving to better sources of credit or no longer needing credit) is not a common reason for dropping out. Business failure and dissatisfaction with the group/staff/institution are common reasons.
  • A high dropout rate can be consistent with reasonably good reported client satisfaction.

Dropout rates

We have gone through all microfinance institutions that report “social performance reports” on MixMarket (you can see the complete list of institutions, with their publicly posted reports, at MixMarket’s social performance report section) and collected the data into this spreadsheet (XLS). (Note that dropout rates are not on the list of “standard” indicators and are not reported by all MixMarket participants, but are included in “social performance reports.”) Here’s a summary of the 60 institutions that report dropout rates:

Dropout rate range # institutions
Exactly 0% 3
0% to 5% 7
5% to 10% 4
10% to 20% 10
20% to 40% 23
40% to 60% 12
60% to 80% 1
80% to 100% 0

Taking the average across all 60, weighted by number of clients, yields an “average” dropout rate of 28%. Details here (XLS). That implies that in a given year, 28 out of 100 clients become non-clients (see the “social performance reports” for the details of the calculation).

Reasons for dropping out

We don’t know of any comprehensive studies of the reasons clients drop out, but in the process of searching for an outstanding microfinance institution, we have encountered several small-scale surveys. We have posted the non-confidential dropout surveys along with a summary in Excel, and hope to clear a couple more in the future (they are broadly consistent with the summary below).

The Bangladesh study specifically states that “One of the reasons that is notable by its almost complete absence from these listings of grounds for drop-out is ‘graduation’” (pg 4). The rest of the studies give the same picture: “graduation” (i.e., the idea that clients now no longer need microfinance because they can access better sources of credit and/or do not need credit) is not cited as a significant factor in any of them, except in the Uganda study (which does not state how common this factor is, but cites it as a factor specifically for “Relatively Well-off drop-outs” (pg iii)).

Business failure is a commonly cited factor (37-58% of clients cite this factor, in the studies that report numbers – see Excel summary). Issues with the “lending group,” the organization or its staff are the other most common factors. The Tanzania study cites “The inability of clients to cope with the rigid MFI policies and procedures” (pg 9) and also vividly describes a group conflict in which the treasurer claimed funds had been stolen (pg 10). The Bangladesh study states that “One of the key determinants of drop-out … is the insistence by field staff that clients take loans” (pg 3-4).

Client satisfaction

The LAPO study (see previous discussion of LAPO, Kiva’s largest partner) looks not only at the reasons for dropping out, but at overall reported client satisfaction.

The former figures seem cause for concern: there is a dropout rate of around 25% (estimated from graph on pg 7) and reasons given include “poor business performance” (applying to 24.2% of dropouts), “Burden of paying for others who had defaulted” (29.5%), and “the attitude of some staff” (cited as a major factor but without quantification). But overall, reported satisfaction looks reasonably strong:


(Note that the repeating of “Didn’t help me at all” is found in the original table.)

We feel these numbers should be taken with a grain of salt, since it seems possible to us that clients could have felt pressure to report positive experiences. But the numbers do serve as a reminder that microfinance institutions have many clients who are (apparently) happy repeat customers.

Bottom line

Most microfinance institutions don’t appear to publicly report dropout rates, much less the reasons for dropping out (this observation based on the small percentage of MixMarket participants who have shared social performance reports). Those that do are likely to have more encouraging numbers than the others, and yet their numbers seem to leave substantial room for concern. Clients seem to drop out, for overwhelmingly negative reasons, at rates averaging 28% and often exceeding 40%.

We don’t mean to overfocus on the negative here. Microfinance institutions could be providing valuable services for many people, and we wouldn’t want donors to stay away from an activity that’s doing good overall even if it is doing damage to some.

But it does seem that the more we dig through the information on microfinance, the less it resembles the stories commonly told about it. Making loans can do good or harm. We feel strongly that people donating money to microfinance institutions should be asking for substantial due diligence – not anecdotes and pictures, and not the commonly cited, misleading metrics like “repayment rate,” but systematically collected information that gets at services’ actual impact on clients.

Orphanages

We haven’t done much work on charities that try to help orphans and vulnerable children, and we intend to do more. Here are some preliminary thoughts, though.

At first glance, this area might seem among the simplest and least controversial. SOS Children’s Villages states, “Our sponsors and donors help children whose parents are not there for them. They may be AIDS orphans, street children, child soldiers or children orphaned by war, poverty or natural disasters. We give these children a mother and a family in a home within an SOS Children’s Village. Donations pay to build the Villages and run them until child sponsors cover the running costs.” Could any sort of “impact evaluation” be helpful here? How can one deny that children without homes should be provided homes if at all possible?

However, the picture becomes far more complex upon reading something like Saundra Schimmelpfennig’s series on orphanages.

  • Donor demand for funding orphanages may be outstripping actual need (we have speculated that cleft surgery and microcredit may face similar issues).
  • Many of the children in orphanages are not actually orphans. Parents may send them there because they find caring for them to be too expensive; orphanages may weaken the incentives for children’s other relatives and community members to take them in.
  • If, in fact, orphanages are one option rather than the only option for care, it becomes much more crucial to determine whether they are providing good conditions for children. Ms. Schimmelpfennig raises questions about this issue.
  • There is an ongoing debate in academia about whether abandoned children are better off in institutions or being cared for by relatives/community. One person with field experience told me he personally saw a situation in which he believed that orphanages were actively making the situation worse, and Ms. Schimmelpfennig’s series also implies that this is a serious possibility.

None of this means that donating to orphanages is a bad idea. What it means is that, as usual, the appealing story you see on a charity’s website has a great deal of complexity and open questions behind it. As usual, it is essential to ask critical questions, and not to let your due diligence end with “That sounds like a clear need.”

Smile Train in its own words

We recently argued that Smile Train has “more dollars than doctors” for its core program. In that light, yesterday’s Virginian-Pilot article (which quotes me) is interesting:

  • The main story is that Smile Train has been trying to make substantial and unrestricted grants to another major cleft surgery charity, Operation Smile. This despite the fact that Smile Train has in the past raised concerns about Operation Smile (“intentionally fabricated tens of thousand of surgeries… distorted its financial reporting… squandered millions of dollars… provided shoddy medical care….”)
  • The story quotes Smile Train’s President as appearing to explicitly support the “more dollars than doctors” idea: “Smile Train focused on funding operations by doctors in the countries in need … Mullaney concedes, though, that in some countries, such as Somalia and Haiti, the need outstrips the number of surgeons available to do the work.”

It’s hard to make sense of Smile Train’s wish to make unrestricted grants to Operation Smile, except by accepting that Smile Train is out of room for more funding in its core program.

Possibly, Smile Train’s concerns about Operation Smile have been addressed. Arguably, the decision to grant extra funds to other organizations is admirable (we don’t know whether other charities respond to the same situation by simply piling up assets). But it certainly seems difficult to argue that Smile Train’s donors should think of themselves as funding more of the “$250 per surgery” core program.

Going deeper on “room for more funding”: Underfunded grant proposals

We previously discussed some simple ways to get at the difficult question of “room for more funding.” One approach that has been more difficult than expected is asking charities themselves to help figure out where more funds are likely to go – answers tend to be vague and tend to target what the charities think we want to hear. How to get specific, concrete, and credible info?

One approach can work specifically for grantmaking charities, i.e., charities that pool donations and make large grants to other organizations. Grantmaking charities are more common than you might think in international aid – arguably any large organization like UNICEF or CARE can be thought of as making grants from its central office to its many projects around the world.

The question we ask such charities is: Can you share examples of strong grant proposals that went underfunded – or rejected – because of insufficient funds?

This is a very different request from asking for rejected grant proposals. An organization may be funding a small percentage of grant proposals, while still funding all reasonable ones. However, an organization that can show proposals that are both strong and underfunded is making a strong case that it has room for more funding.

The Against Malaria Foundation, our 3rd-ranked international aid charity, gave a stellar response to this request. At its GiveWell review, you can see both approved and rejected proposals, and it seems fairly clear that funds are indeed the bottleneck to approving distribution of more insecticide-treated nets.

Asking for a grantmaking organization’s “best unfunded grant proposals” is a pretty simple idea. But you won’t see it requested in any tax return, included in any online charity information database, or mentioned in any of the various impact/outcomes frameworks that various nonprofit sector actors are putting together. Evidence that the “room for more funding” question is largely neglected as of today.

Some simple ways to check “room for more funding”

We have been struggling with the “room for more funding” question since the first days of GiveWell, and we have gradually developed a variety of approaches to it.

The most basic approach, and the one we’ve used for most of our history, consists of the following:

  1. Gain confidence in an entire organization; do not overfocus on one program.
  2. Examine financial data, looking for a few basic patterns and warning signs.
  3. Ask the charity how additional funds will be used.

Gain confidence in an entire organization

We generally seek to scrutinize and examine activities accounting for over 50% (at a minimum) of a charity’s budget. Some organizations are small enough or simple enough that doing so is fairly straightforward. Other organizations are large and complex but very well-documented. Organizations that are both complex and poorly documented generally don’t get past the first stage of our process.

Our decision to evaluate entire organizations instead of individual programs has, arguably, drastically reduced our options for recommended charities. We have found that many large organizations can’t even answer the “What do you do?” question at the organization level.

But as of now, we see no other reasonable choice. We strongly doubt that donating to a particular program is wise or efficacious.

If you gain confidence in a whole organization, you can give there without worrying too much about what specific activity is next on the agenda. As long as you continue to hold the organization accountable over time.

Basic patterns in financial data

Late in the process with a strong organization, we will analyze its financial data. The details of our financial metrics here. Questions we ask include:

  • Is the charity large enough that it can plausibly absorb substantial additional funds? (This question is actually applied at the beginning of our process.)
  • Have the charity’s expenses been growing over time, implying that it is on a general trajectory of expansion?
  • Does the charity have a reasonable level of assets, given its size? If its assets are too low, we worry that it isn’t stable; if they are too high, we worry that it is piling up reserves because it cannot productively spend additional funds.
  • Which programs does the charity spend most of its funds on? Which programs have been expanding in the past, and are projected for future expansion, implying that they are on a general trajectory of expansion? (Note that this question generally requires a different kind of financial data than is provided in audited financials and tax returns. And we have been surprised at some of the charities that cannot/will not share such financial information.)

We don’t have a set formula; no single “No” answer will disqualify a charity from getting recommended. But asking these basic questions has raised serious questions about some charities (examples: Smile Train, The Carter Center), while our top charities have more or less sailed through these basic tests.

Asking charities what their plans are

This approach has turned out to be far more difficult than it sounds.

In our first year of research, we used a grant application with a question asking specifically:

What would a significant increase in funding (including, but not limited to, a Clear Fund grant) allow your organization to do that it could not do otherwise?

You can see answers via the grant applications submitted by U.S. equality of opportunity charities. Overall, responses were not very helpful.

  • Charities have a tendency to try to tell funders what they want to hear.
  • Charities often are very bad at guessing what we want to hear.

In many cases we followed up with charities and tried harder to make our meaning clear and get meaningful answers, but it’s only recently that we’ve really developed questions that seem to get us somewhere. We’ll be discussing these in future posts.