Reader Evan writes:
I’ve been thinking about how best to donate to Haiti, and I reviewed some of the materials on your website and found them pretty helpful and persuasive. So thank you! But then my law firm announced that it would match donations to the Red Cross or Doctors Without Borders. Given that, I think I have to donate to one of those orgs: even if my money would probably be better spent elsewhere, it’s hard to imagine that it would be more than twice as well spent. Do you disagree?
My intuition here is different than Evan’s. My guess would be that giving to one of our top-rated charities could easily accomplish more than twice as much good as supporting the efforts of the Red Cross or Doctors Without Borders in Haiti.
This guess is largely based on two factors:
- The large divergence in relative cost-effectiveness of different programs (which can approach a factor of 1,000, not just a factor of 2) combined with the reasonable position that disaster relief is not among the most cost-effective avenues for charitable funds.
- A back-of-the-envelope calculation for cost-effectiveness of efforts in Haiti which puts it well below the cost-effectiveness of our top charities.
In this post, I’ll look at the first factor. I’ll post more on the second issue in a future post.
Cost-effectiveness for different approaches to helping people varies widely
The most cost-effective programs are so much more impactful per dollar than other programs that a much smaller donation to a top program will likely help significantly more people. We’re careful about our use of cost-effectiveness figures, and the Disease Control Priorities Report’s (DCP) in particular (which we think constitute “best-case” scenarios rather than what a donor can expect from his donation), but we do think they give a reasonable basic sense of the differences between different kinds of programs.
Figures 2.2 and 2.3 on pages 41-2 of the DCP report provide cost-effectiveness estimates for many common programs charities run. (These are all presented using the $/DALY metric. For more information on what this is, see our overview for interpreting the DALY metric.) Some of the most cost-effective programs are deworming programs ($3/DALY), expanding immunization coverage ($7/DALY), and bednets to prevent malaria ($11/DALY).
Some of the least cost-effective (but common among charities) programs are improved water and sanitation to prevent diarrhea ($4,185/DALY), some types of maternal and neonatal care packages ($1,060/DALY), and Antiretroviral therapy to treat HIV/AIDS ($922/DALY).
These examples are not meant to demonstrate that the less cost-effective programs are necessarily less worthy, but they do illustrate that the impact per dollar a donor can expect from his gift can easily vary by 2-3 orders of magnitude, even under assumptions that programs are essentially being carried out as intended. Of course, if some programs are poorly executed or simply ineffective, the difference can be much larger still.
With that context, when choosing which charity to support, I wouldn’t trade much confidence-in-an-organization to merely double the size of my donation.
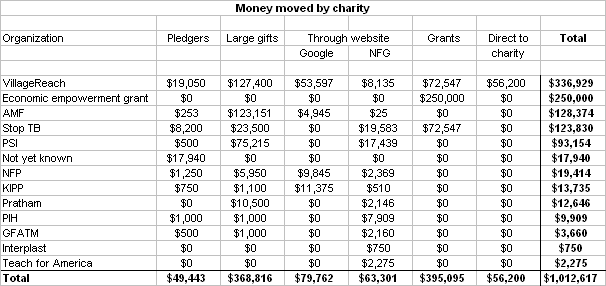
As we’ve discussed before, with limited information we’d tentatively guess that disaster relief funds are closer to the less-cost-effective end of the range rather than the most-cost-effective end. With that in mind, I’d guess that a gift to VillageReach or Stop TB could easily accomplish more than twice as muc good as a gift supporting the Red Cross or Doctors without Borders in Haiti.
The above is very general and though relevant, not at all specific to the situation in Haiti. In a future post, I’ll post more on some specifics regarding Haiti and why I think it offers further support to the notion that donors can accomplish more good by giving to our top charities, even if they give less.
Two other small notes
There are a couple other factors that contribute (though in a relatively small way) to my conclusion here:
- It doesn’t seem appropriate to consider causing one’s company to give a donation to be equivalent to doubling one’s cost-effectiveness. The firm may have taken matching funds from a pool already allocated to charitable giving, or the partners may have given the funds to charities themselves. Even if the funds wouldn’t otherwise go to charity, the firm likely has another motive for giving, which should lead you to consider how this program differs from other embedded giving programs, which we think are of dubious additional value.
- Giving to a charity because it has demonstrated effectiveness has the additional benefit of signaling to other charities that effectiveness matters to donors. A core belief of ours at GiveWell is that rewarding charities for effectiveness in changing lives will incentivize other charities to improve their programs to compete for those donor funds. Proactive giving (i.e., trying to choose the best charity available) furthers this dynamic; passive giving (choosing from a predefined list) hampers it. It’s also quite possible that in a very direct sense telling your company that you’ve chosen to give in this way could influence them to adjust their own giving towards more considered and effective charities.
