 We were referred to the Against Malaria Foundation today. It’s the most transparent developing-world aid organization we’ve seen to date.
AMF grants funds to NGOs that distribute insecticide-treated nets (ITNs) to fight malaria. ITN distribution is a well-established method for saving lives and lowering the burden of malaria (see the “Insecticide-treated nets” section of the malaria chapter in the Disease Control Priorities Project).
But what sets AMF apart from other organizations carrying out similar programs is that they publish all the details for all of their projects.
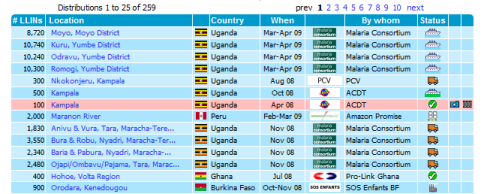
This map lists all programs, by country, date, partners, and status (whether the nets are en route, have arrived, are being distributed, etc.) Click on an individual program and you can see the full proposal that was submitted and funded (and the proposals are quite concrete and specific), and, when applicable, other materials – including the post-project report and even shipping records. Pictures and videos are also available. Here’s an example of a project in progress; here’s a completed project.
 Finally, you can see which donors’ gifts were used to fund the project. There’s been a lot of excitement over organizations such as Kiva and DonorsChoose because of their ability to link donors’ money directly with people served. This organization does something very similar, but it’s distinguished in that the types of projects it’s linking donors up with (bednet distribution projects) are larger-scale projects serving many people at once, and are well documented (see link above) in terms of their impact on human lives.
We’re going to have to spend more time with all of this information to check how the actual cost-effectiveness is living up to the top-line numbers. What we know now is that if all charities were as transparent as AMF, our job would be a lot easier.