The GiveWell Blog

Update on GiveWell’s web traffic / money moved: Q3 2014

This post covers the first three quarters of 2014 and is being published late due to staff focusing on updating GiveWell’s charity recommendations in the fourth quarter.

In addition to evaluations of other charities, GiveWell publishes substantial evaluation of itself, from the quality of its research to its impact on donations. We publish quarterly updates regarding two key metrics: (a) donations to top charities and (b) web traffic.

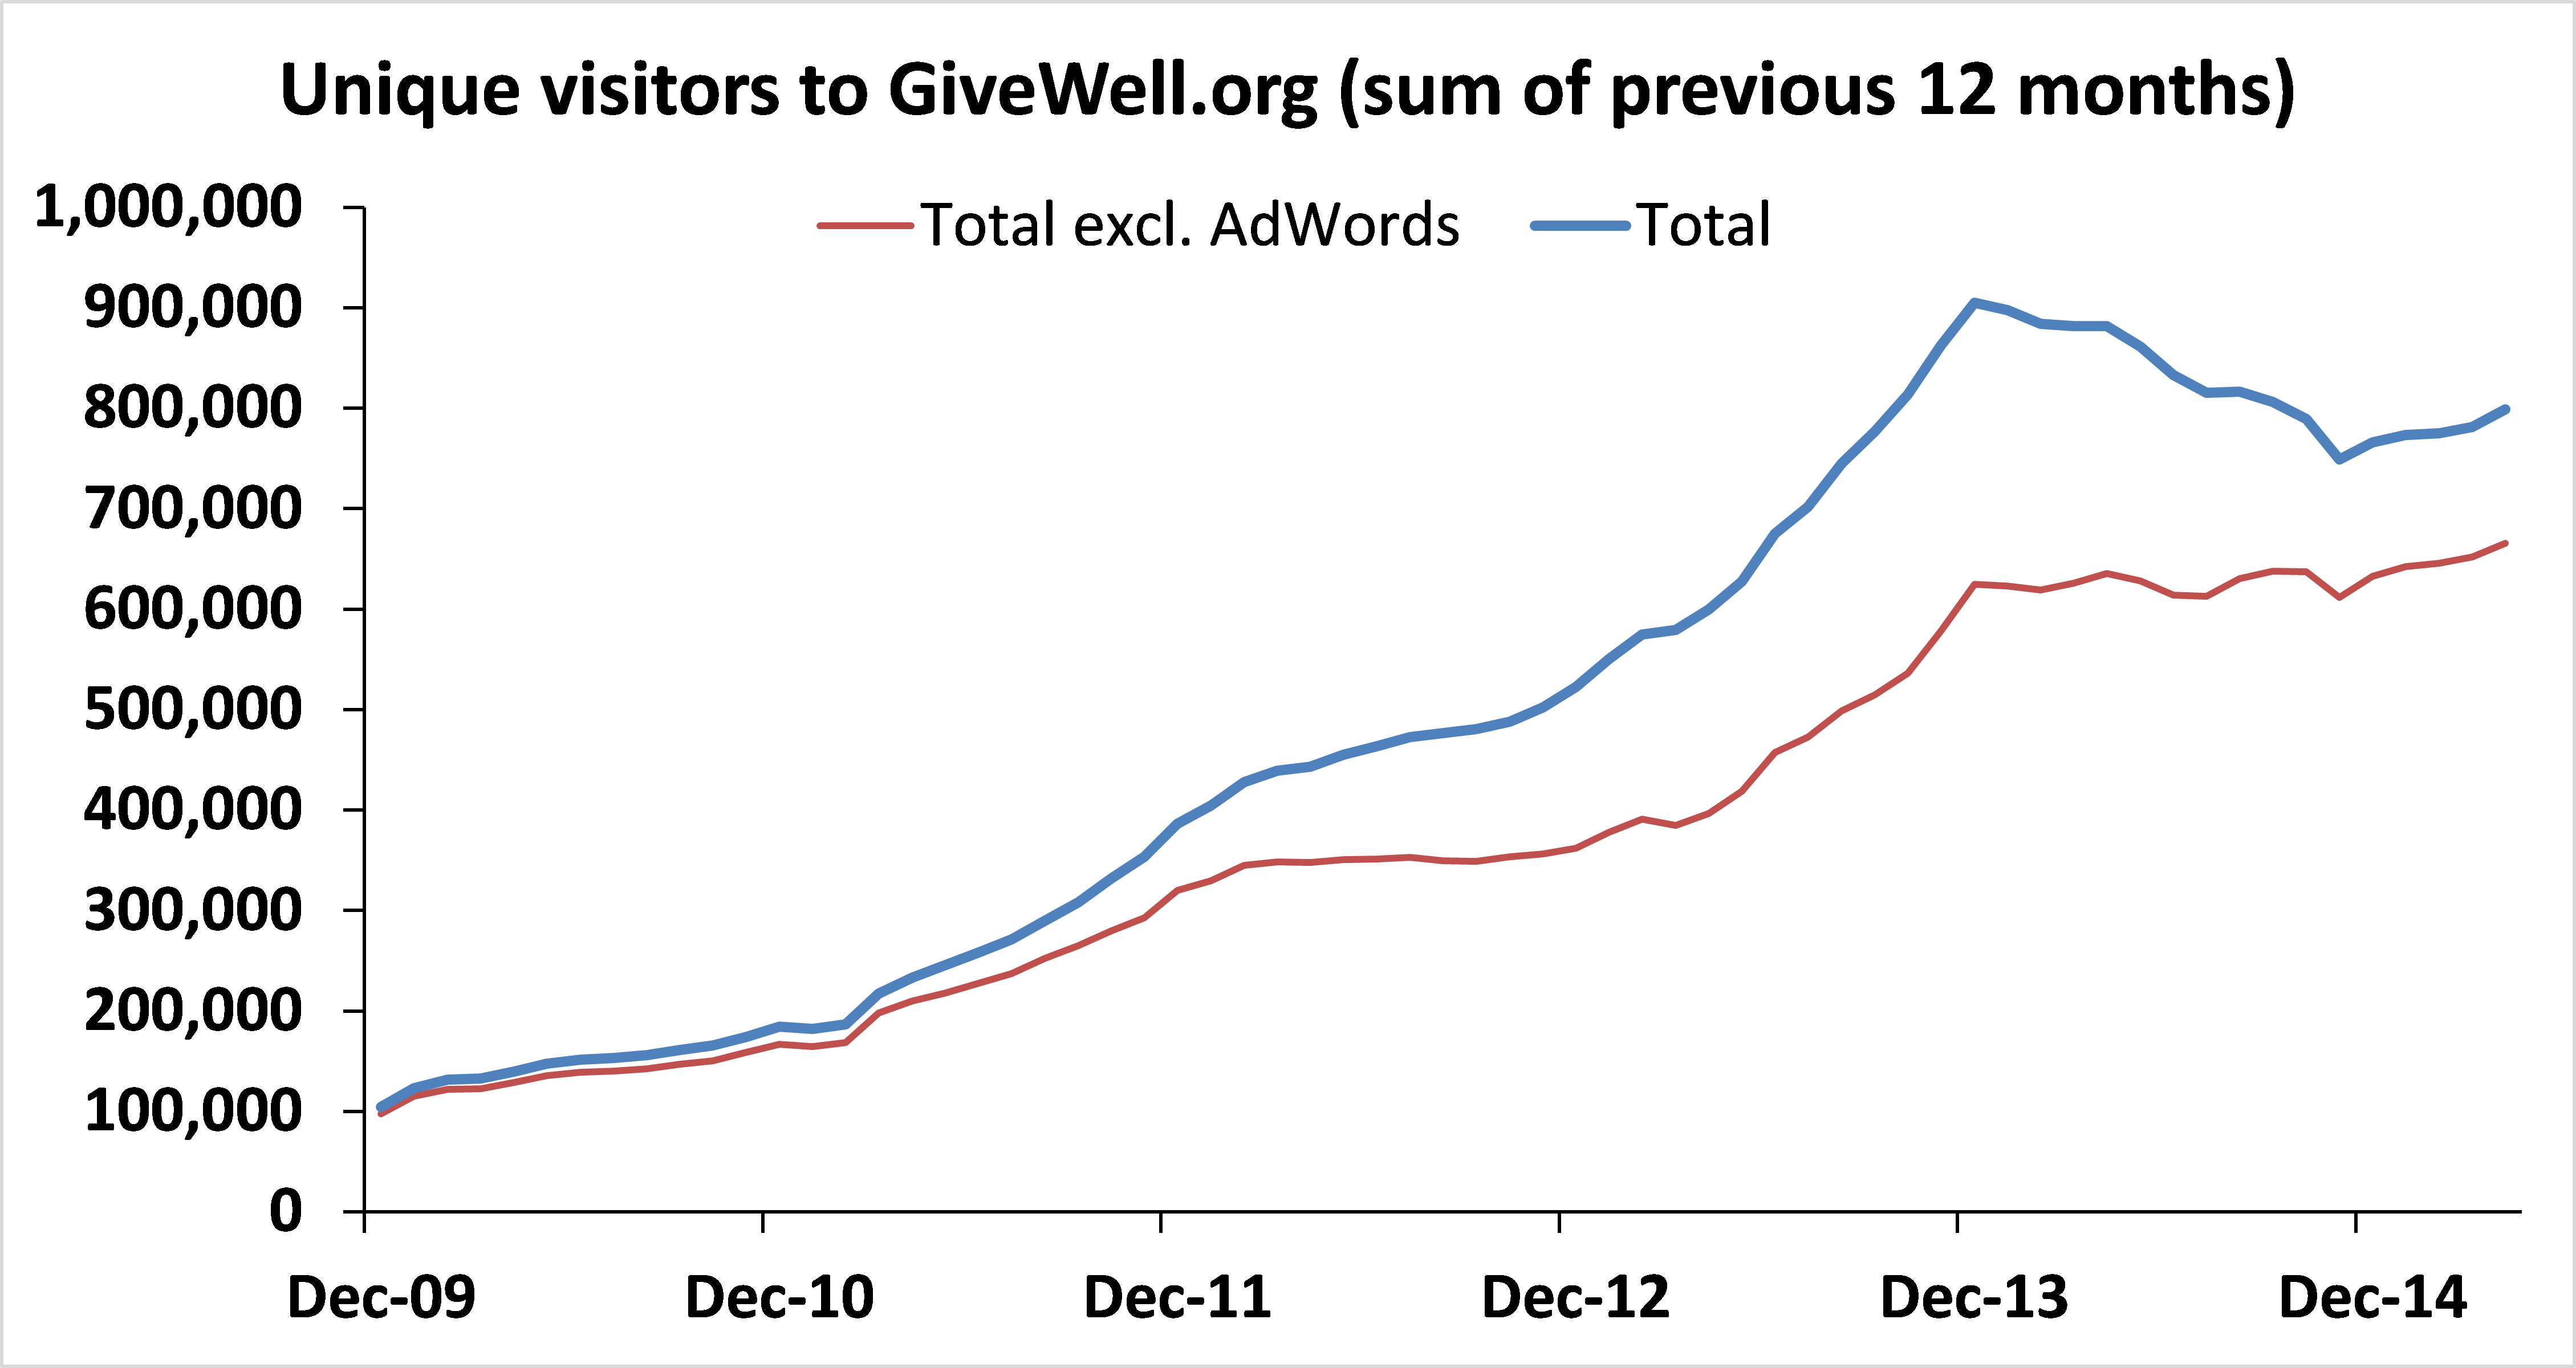
The table and chart below present basic information about our growth in money moved and web traffic in the first three quarters of 2014 (note 1).

Money moved: first three quarters

Growth in money moved, as measured by donations from donors giving less than $5,000 per year, continued to slow in the third quarter of 2014 compared with the first and second quarters, and was substantially weaker than growth in the first three quarters of 2013.

The total amount of money we move is driven by a relatively small number of large donors. These donors tend to give in December, and we don’t think we have accurate ways of predicting future large gifts (note 2). We therefore show growth among small donors, the portion of our money moved about which we think we have meaningful information at this point in the year.

Web traffic through November 2014

We show web analytics data from two sources: Clicky and Google Analytics. The data on visitors to our website differs between the two sources. We do not know the cause of discrepancy (though a volunteer with a relevant technical background looked at the data for us to try to find the cause; he didn’t find any obvious problems with the data). (Note on how we count unique visitors.)

Traffic from AdWords decreased in the first three quarters because in early 2014 we removed ads on searches that we determined were not driving high quality traffic to our site (i.e. searches with very high bounce rates and very low pages per visit).

Data in the chart below is an average of Clicky and Google Analytics data, except for those months for which we only have data (or reliable data) from one source.

The raw data we used to generate the chart and table above is in this spreadsheet.

Slowing growth?

The above indicates that our growth slowed significantly in 2014 relative to last year (and previous years). It is possible that the numbers above are affected by the fact that (a) growth in the second quarter of 2013 was particularly strong due to a series of media mentions (as we previously noted) or (b) differences in the way that our recommended charities track donations (we would guess that this could explain a difference of a few hundred donors). Our guess is that both of these factors contribute but do not fully explain the slower growth.


Note 1: Since our 2012 annual metrics report we have shifted to a reporting year that starts on February 1, rather than January 1, in order to better capture year-on-year growth in the peak giving months of December and January. Therefore metrics for the “first three quarters” reported here are for February through September.

Note 2: In total, GiveWell donors have directed $3.76 million to our top charities this year, compared with $2.16 million at this point in 2013. For the reason described above, we don’t find this number to be particularly meaningful at this time of year.

Note 3: We count unique visitors over a period as the sum of monthly unique visitors. In other words, if the same person visits the site multiple times in a calendar month, they are counted once. If they visit in multiple months, they are counted once per month.

Google Analytics provides ‘unique visitors by traffic source’ while Clicky provides only ‘visitors by traffic source.’ For that reason, we primarily use Google Analytics data in the calculations of ‘unique visitors ex-AdWords’ for both the Clicky and Google Analytics rows of the table.


December 2014 update on GiveWell’s funding needs

This post provides an update on GiveWell’s operating budget and funding needs. It is aimed at close followers of GiveWell, particularly those who have a high degree of trust in and alignment with us and are primarily seeking to make the highest-impact gift according to our (admittedly biased) opinion.

Our opinion is that for such people (as opposed to the bulk of our donors, who we feel place more emphasis on neutral recommendations, evidence bases, etc.), direct, predictable support of GiveWell represents the highest-impact giving opportunity.

Below, we provide more details on our current funding situation. For more background on our philosophy on fundraising, see our October 2013 post.

What are our current projected revenues and expenses?

We currently project 2015 revenues of $2.16 million and expenses of $2.33 million. We held $1.73 million in reserves at the end of October (the last month for which we closed our books before updating our budget forecast). Because we receive a large portion of our annual funding in December (approximately 40%), this tends to be the time of year when our reserves are lowest.

Our budget file (.xlsx) provides additional detail.

Our projected revenues include donations we expect to recur in the future (because donors have either explicitly told us that they would give again or because they have given consistently enough in the past that we expect their donations to recur) as well as some expectation that (a) some portion of lower probability donations recur and (b) organic growth in unrestricted revenues continues.

Our projected expenses include our best guesses about the number of staff we plan to add (erring on the conservative side — we’d prefer to project an additional hire we don’t make than lack the funds to hire someone outstanding) and the salaries we anticipate paying them.

How has our fundraising and budget situation changed over the past year?

Our staff grew substantially since the end of 2013. We made 7 additional hires in 2014 to bring our total staff size to 18. We also work with 7 conversation notes writers who produce high-quality summaries of conversations we have with experts.

We anticipate staff continuing to grow in 2015. We made several offers to summer research analysts, two of whom (so far) have accepted our offer of employment, and we project some additional hiring. In 2014, we also increased salaries for all staff who had been with us at least a year commensurate with their additional experience and contributions and GiveWell’s increased influence.

Some of this new staff has supported the Open Philanthropy Project, but most have primarily worked on our traditional work focused on top charities. We were able to produce in-depth reviews of significantly more charities than we had in the recent past while much of our senior staff time has gone to continuing our progress on the Open Philanthropy Project; this was made possible by the new staff we have brought on over the past 18 months.

Currently, we estimate that approximately 50% of our unrestricted funding supports the Open Philanthropy Project and 50% supports our traditional, top charities work. In addition, Good Ventures made a $675,000 grant in November 2013 to support research-related expenses for the Open Philanthropy Project.

At what point would we consider our funding gap closed?

At the point where we hit our excess assets policy, we would regrant any funds given to GiveWell to our recommended charities.

Using a conservative revenue projection (which we believe is appropriate when considering granting out funds), we project 12-month-forward expenses as of November 2015 (i.e., expenses we would incur from November 2015 to October 2016) of $1.76 million more than what we project holding in reserves. Therefore, we would require $1.76 million in additional funding before we would begin to grant out funds.

Under a different, less conservative revenue projection, we project 12-month-forward expenses as of November 2015 that are approximately $1.16 million higher than the reserves we project holding. Were we to receive $1.16 million more than we currently project, we would likely no longer encourage additional donors to give to us as strongly as we do today (e.g., via blog posts like this).

What will we do if we raise more or less funding than we anticipate?

If we raise more funding than we anticipate, we would likely reduce the staff time we put into fundraising. This is currently quite low but accounts for, on average, approximately 5 hours per month each from Elie, Holden, and Natalie, time that would otherwise be devoted to research. We currently plan to maintain this level of time commitment to fundraising and are optimistic that posts like this enable us to raise the funding we need without devoting more time to fundraising.

If we raise less funding than we anticipate, Elie and Holden would spend more time on fundraising. If this step didn’t succeed in raising the funding we need, we would consider the following options (likely in this order): (a) slowing or halting planned staff expansion, (b) requesting additional funding from Good Ventures, and (c) laying off staff. Note that we believe these scenarios are extremely unlikely given our current situation, but we require continued, growing support to ensure that we avoid them.

Are GiveWell’s projected operating expenses reasonable or excessive in light of its impact?

We anticipate 2014 money moved to top charities of approximately $25 million and project expenses in 2015 of $2.27 million. We previously wrote that we believe expenses that are 15% of money moved are well within the range of normal.

Good Ventures also directed an additional $8.4 million to funding opportunities identified by the Open Philanthropy Project. In 2014, we project spending approximately $300,000 of the Good Ventures’ research grant mentioned above.

What is our recommendation?

For donors who have a high degree of trust in and alignment with GiveWell, we recommend unrestricted gifts to GiveWell.

For donors who want to support our work because they value it but are otherwise primarily interested in supporting charities based on neutral recommendations, strong evidence, etc., we recommend giving 10% of their donation to GiveWell.

You can do this by sending us a check and filling out our check donation form (details on our donate page) with the allocation for your donation. If you’d like to give 90% of your gift to GiveWell for regranting to top charities and 10% to GiveWell unrestricted you can do so via this page: select the “grants to recommended charities (90%) and unrestricted (10%) option.

Request for input

We’re planning to redesign our website in early 2015. We last worked on our website in 2009, and it’s time to refresh it.

Please let us know if you have any suggestions you’d like us to consider. In particular:

  • Is there functionality you wish our website had?
  • Is there information you wish were easier to find?
  • Is there a message you think we should be more actively communicating?

If you have thoughts, please share them either via blog comment or by emailing us at info@givewell.org.

Update on the Ebola outbreak

Over the past couple of months, we’ve put some time into trying to understand the Ebola containment effort and whether it represents a strong giving opportunity. Our process has included conversations and correspondence with about 15 people including major private donors to the containment effort and representatives of the UN, CDC, WHO, and Doctors without Borders. We have also kept informed on the outbreak by reading updates from the UN, CDC, WHO, and University of Pittsburgh Medical Center. (More on our process)

Yesterday, we published a writeup summarizing the status of the outbreak and control effort, the picture of funding provided and needed, and our view on the cost-effectiveness of donations.

The key points, in our view, are:

  • It has been very difficult – we think unnecessarily so – to get a picture of the funding needs and the likely impact of additional donations. It’s inevitable that a situation like this one will be difficult to understand and follow as it’s unfolding, but we’ve struggled to find even fairly basic information. We haven’t been able to find any consolidated estimate of how much total funding is needed for core activities and how much of that funding has come in so far. The closest we’ve found has been an appeal specific to UN partner agencies and major NGOs; this appeal doesn’t appear to account for the (significant) activities undertaken and funds provided directly by donor governments. (Note that Center for Global Development scholars have expressed similar sentiments about the lack of reliable information on donor contributions, in a post titled How Much Is Actually Being Spent on Ebola?) Furthermore, the description of planned activities for the UN partner agencies and major NGOs is very broad and high-level. We’ve found very little information on how additional funds would be spent. More
  • Substantial funding has come forward, particularly from governments. As of November 28, over $2 billion in funding for immediate relief efforts had been tracked, and more recently the US Congress approved over $5 billion in funding “to contain and end the Ebola outbreak at its source in Africa, enhance domestic preparedness, speed the procurement and testing of vaccines and therapeutics, and accelerate global capability to prevent the spread of future infectious diseases.” (It appears that about half of this will be spent domestically.) We believe that this outbreak may have been less compelling for individual donors than disasters such as the 2010 Haiti earthquake and 2011 Japan earthquake/tsunami; on the other hand, it has attracted significant funding from governments, perhaps in part because of fears that the outbreak might spread beyond Africa. More
  • There has been significant progress toward stopping the outbreak, though there are still areas with intense transmission. It’s hard to have high confidence in data about the containment effort, but broadly speaking, it looks as though the effort has ramped up significantly; that it has largely (though not completely) met its goals regarding safe burials and case isolation; and that the overall number of cases in Liberia (where the outbreak has affected the most people) has declined substantially and come in very far below projections made at the beginning of the outbreak. The situation appears to be worst in Sierra Leone, where there are still major Ebola “hotspots,” and it remains possible that the course of the outbreak could change rapidly. More
  • On the margin, we don’t expect additional donations from our audience to be critical to stopping the outbreak. We see the current funding gap as hindering how far into the future the Ebola response team can plan (e.g. contracts for some employees lasting 2 months instead of 6) or leading to the use of lower-quality equipment (e.g. ambulances with a dial-up modem instead of a VSat) rather than as, for example, preventing work in some areas altogether. More funding may be needed in the future, but we are optimistic that government donors will come forward with the bulk of such funding. More
  • We aren’t recommending additional donations to the containment effort in place of donations to our top charities, but we do feel the containment effort has been an outstanding use of funding. We estimate that the several billion dollar effort, taken as a whole, could easily have saved lives as cost-effectively as our top charities – something that we don’t believe is usually the case in a disaster. We doubt that additional donations from our audience – beyond what has already been committed and will likely be committed in the future from others – would have comparable cost-effectiveness. We see the commitments governments have provided as outstanding uses of funds and hope they deliver on their commitments and close any remaining funding gap. More
  • We remain interested in opportunities to strengthen disease surveillance over a longer time frame, to prevent the spread of this outbreak and help contain future outbreaks at earlier stages. We previously argued: “The best opportunities to prevent or contain the epidemic were probably before it was widely recognized as a crisis (and perhaps before Ebola had broken out at all – more funding for preventive surveillance could have made a big difference).” In our conversations around this outbreak, we have heard that there may be opportunities to rebuild health systems with stronger general surveillance capacity, and we are interested in this as part of our work on biosecurity (a likely priority of our Open Philanthropy Project work on global catastrophic risks).

As is usually the case in a vivid and widely publicized disaster, a large amount of funding has come forward, and it’s been hard to understand the developing situation and the role of additional donations – two factors that generally make us unlikely to recommend giving. In this case, the size of the threat and the potential difference to be made by a containment effort were unusually large, and we believe that the funding that went to this effort has generally been money unusually well spent.

Should we expect an ongoing study to meet its “goal?”

One of our newly “standout” charities, Development Media International (DMI), is in the midst of a randomized controlled trial. So far, all we have from the trial is information about self-reported behavior change, and we’ve tried to use that information to estimate how many lives the program will likely save (for purposes of our cost-effectiveness analysis). We estimate that the measured behavior changes should equate to about a 3.5% reduction in child mortality. However, DMI is hoping for a 19% reduction, and by our estimate, if it falls short of 10-14%, it will likely fail to find a statistically significant impact. What should we put more credence in – GiveWell’s projection based on available data about behavior change, or DMI’s projection?

Ordinarily, I’d be happy to consider the GiveWell estimate a best guess. I’m used to charities’ estimates turning out to be optimistic, and DMI’s estimate is based on a general model rather than on the actual data we have about its impact on behavior.

However, I find myself very uncomfortable predicting a figure of 3.5% when the people carrying out a study – and paying the considerable expenses associated with it – are expecting 10-20%. I’m uncomfortable with this discrepancy for two reasons:

  • It’s a little hard to imagine that an organization would go to this level of expense – and reputational risk – if they weren’t fairly confident of achieving strong results. Most predictions and projections charities put out are, in a sense, “cheap talk,” by which I mean it costs a charity little to make strong claims. However, in this case DMI is conducting a study costing millions of dollars*, and by being public about the study, they face a significant public relations risk if the results are disappointing (as our projection implies they will be).
  • I also struggle to think of examples of studies like this one – large, expensive, publicized studies focused on developing-world health or economic empowerment – that have turned out to be “disappointing” from the perspective of people carrying out (and/or paying for) the study. Though I do know of a fair number of studies showing “no impact” for an intervention, I believe they’ve generally been academic studies looking at very common/popular interventions (e.g. improved cookstoves, microlending). These “no impact” results were noteworthy in themselves, and didn’t necessarily reflect poorly on the people conducting or paying for the studies. I have a much harder time thinking of cases in which a major developing-world study found results that I’d consider disappointing or embarrassing for those carrying out or funding the study. The only one that comes to mind is the DEVTA trial on vitamin A and deworming.

I haven’t taken the time to systematically examine the intuition that “developing-world studies rarely find results that are disappointing/embarrassing for those carrying out the study.” It’s possible that the intuition is false; it’s also possible that it’s an artifact of the sort of publication bias that won’t affect DMI’s study, since the DMI study’s existence and hypothesis are already public. Finally, it seems worth noting that I don’t have the same intuition about clinical trials: indeed, failed clinical trials are frequent (especially in the relatively expensive Phase II).

With that said, if my intuition is correct, there are a couple of distinct possible explanations:

  1. Perhaps, in developing-world settings, it is often possible to have a good sense for whether an intervention will work before deciding to run a formal study on it. Accordingly, perhaps expensive studies rarely occur unless people have a fairly good sense for what they’re going to find.
  2. Perhaps publication-bias-type issues remain important in developing-world randomized studies. In other fields, I’ve seen worrying suggestive evidence that researchers “find what they want to find” even in the presence of seemingly strong safeguards against publication bias. (Example.) Even with a study’s hypothesis publicly declared, we believe there will still be some flexibility in terms of precisely how the researchers define outcomes and conduct their analysis. This idea is something that continues to worry me when it comes to relying too heavily on randomized studies; I am not convinced that the ecosystem and anti-publication-bias measures around these studies are enough to make them truly reliable indicators of a program’s impact.

Even with #2 noted as a concern, the bottom line is that I see a strong probability that DMI’s results will be closer to what it is projecting than to what we are projecting, and conditional on this, I see a relatively strong probability that this result will reflect legitimate impact as opposed to publication bias. Overall, I’d estimate a 50% chance that DMI’s measured impact on mortality falls in the range of 10-20%; if I imagine a 50% chance of a 15% measured impact and a 50% chance of a 3.5% measured impact (the latter is what we are currently projecting), that comes out to about a 9% expected measured impact, or ~2.5x what we’re currently projecting.

In either case, I’ll want our cost-effectiveness estimate to include a “replicability adjustment” assigning only a 30-50% probability that the result would hold up upon further scrutiny and replication (this adjustment would account for my reservations about randomized studies in general, noted under #2 above). Our current cost-effectiveness estimate assigns a 50% probability. Overall, then, it could be argued that DMI’s estimated cost-effectiveness with the information we have today should – based on my expectations – be 1.5-2.5x what our review projects. That implies a “cost per life saved” of ~$2000-$3300, or about 1-1.7x as strong as what we estimate for AMF. It is important to note that this estimate would be introducing parameters with a particular sort of speculativeness and uncertainty, relative to most of the parameters in our cost-effectiveness calculations, so it’s highly debatable how this “cost per life saved” figure should be interpreted alongside our other published estimates.

DMI has far less of a track record than our top charities this year. In my view, slightly better estimated cost-effectiveness – using extremely speculative reasoning (so much so that we decided not to include it in our official cost-effectiveness estimate for DMI) – is not enough to make up for that. Furthermore, we should know fairly soon (hopefully by late 2015) what the study’s actual results are; given that situation, I think it makes sense to wait rather than give now based on speculation about what the study will find. But I do have mixed feelings on the matter. People who are particularly intent on cost-effectiveness estimates, and agree with my basic reasoning about what we should expect from prominent randomized studies, should consider supporting DMI this year.

*The link provided discusses DMI’s overall expenses. Its main activity over the time period discussed at the link has been carrying out this study.

We’re happy to talk to you!

If you’re currently trying to figure out where you’ll give this year, and you think it might be helpful to talk to us about your decision, feel free to contact us at info@givewell.org.

We work hard to put all the relevant information about our recommendations on our website, but we know it can sometimes be hard to fully digest, so don’t hesitate to reach out to us and talk. Talking to donors about their plans for allocating their giving is something we do regularly and we’d be happy to do more of it.

We’re not sure how big a response we’ll have to this and we have limited staff (especially over the next couple of weeks), so if you email us please let us know how much you’re thinking about donating. If necessary, we’ll prioritize larger givers, though we hope to be able to speak with everyone who gets in touch.