In addition to evaluations of other charities, GiveWell publishes substantial evaluation of itself, from the quality of its research to its impact on donations. We publish quarterly updates regarding two key metrics: (a) donations to top charities and (b) web traffic.
The table and chart below present basic information about our growth in money moved and web traffic in the first three quarters of 2013 (note 1).
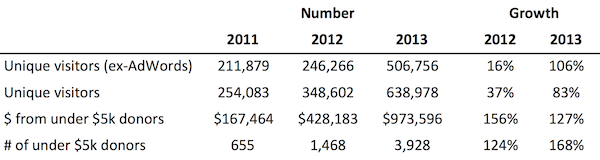
Growth in money moved, as measured by donations from donors giving less than $5,000 per year, remained above 100% through the third quarter. We base this figure solely on small donors because in the past we’ve seen that growth in small donors earlier in the year provides an indication of overall growth at the end of the year. However, because a significant proportion of our money moved comes from a relatively small set of large donors, we don’t place significant weight on this projection.
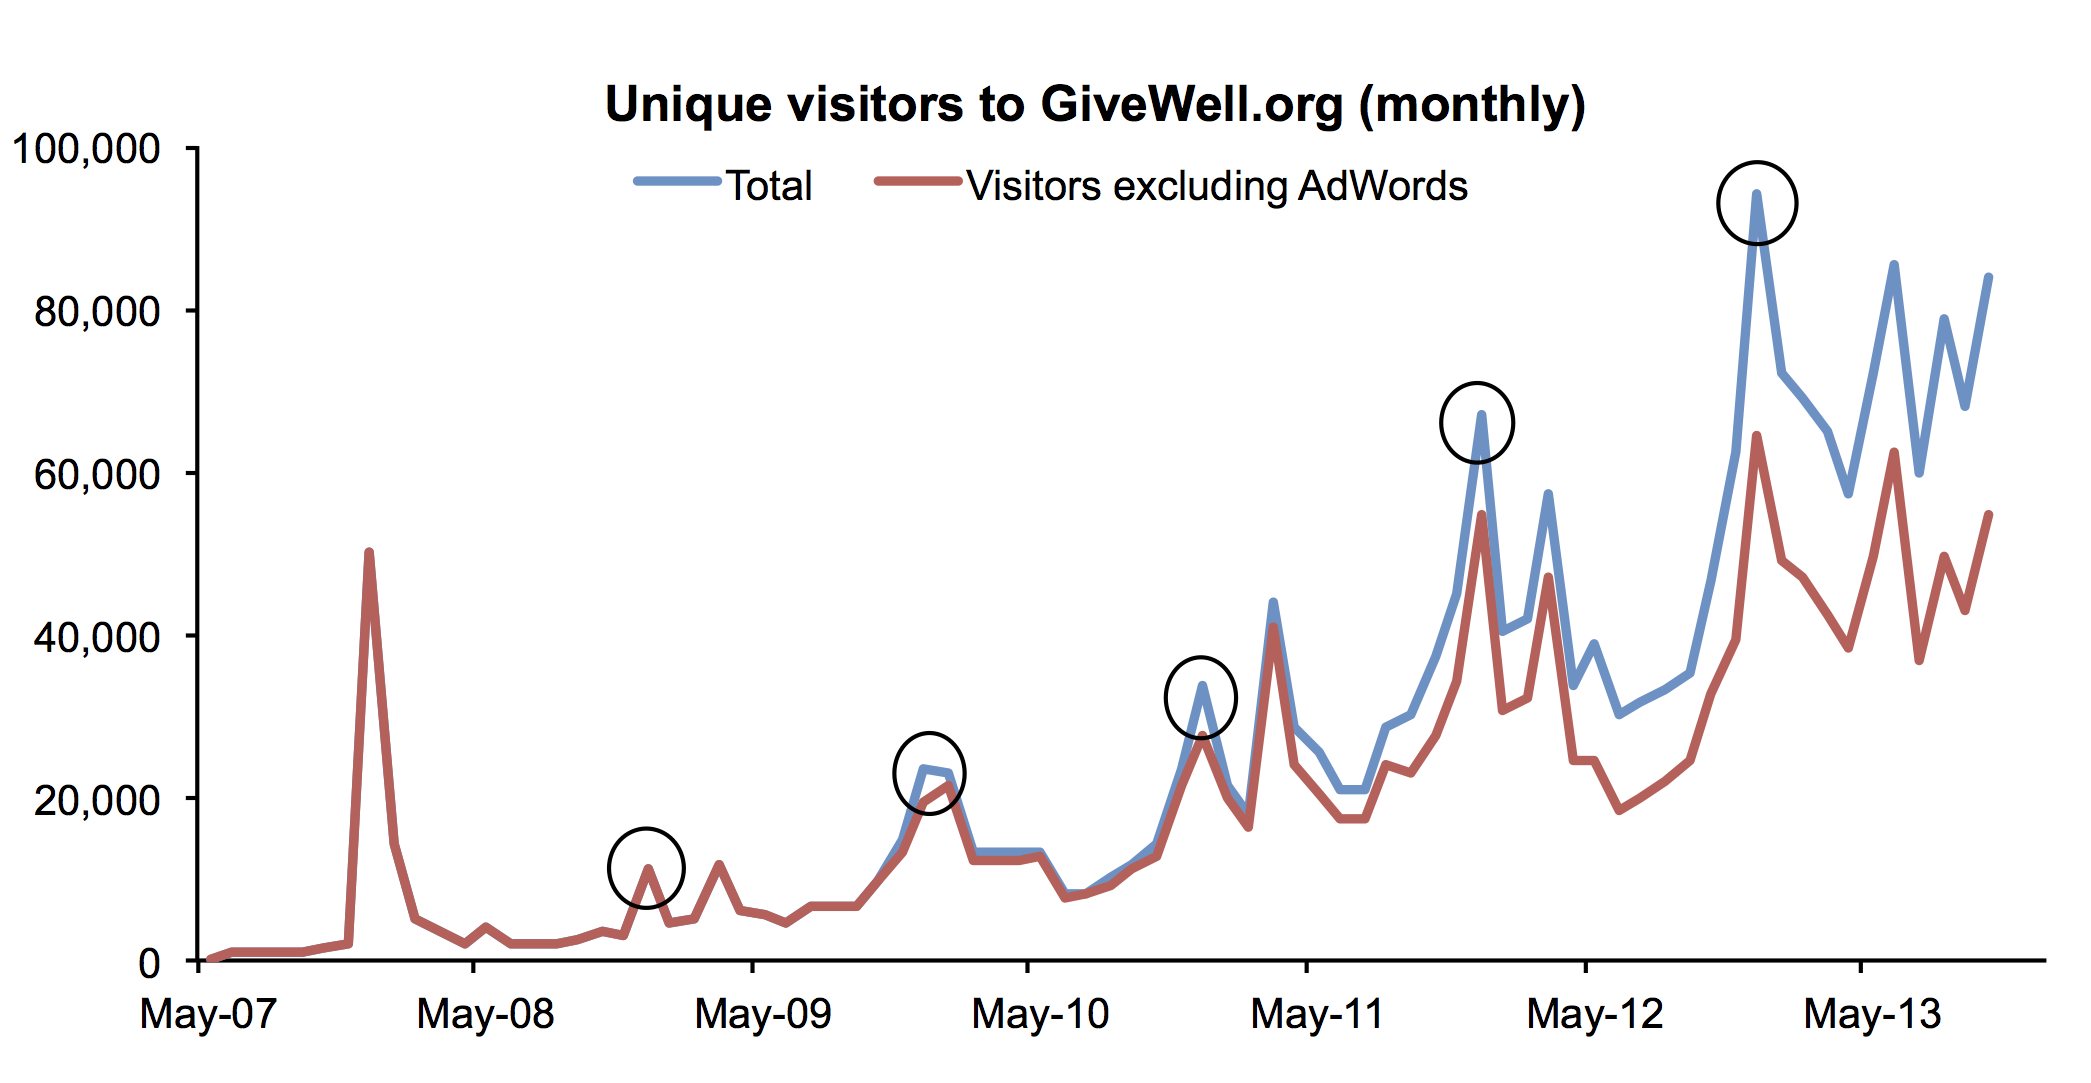
Website traffic tends to peak in December of each year (circled in the chart below). Growth in web traffic has generally remained strong in 2013. So far in 2013, there have been 638,978 monthly unique visitors (calculated as the sum of unique visitors in each month) to the website, compared with 348,602 at this time in 2012, or 83% annual growth.
Note 1: Since our 2012 annual metrics report we have shifted to a reporting year that starts on February 1, rather than January 1, in order to better capture year-on-year growth in the peak giving months of December and January. Therefore metrics for the first three quarters of 2013 reported here are for February through October.
Note 2: The majority of the funds GiveWell moves come from a relatively small number of donors giving larger gifts. These larger donors tend to give in December, and we have found that, in past years, growth in donations from smaller donors throughout the year has provided a reasonable estimate of the growth from the larger donors by the end of the year.
In total, GiveWell donors have directed $2,077,351 to our top charities this year, compared with $1,804,541 at this point in 2012. For the reason described, we don’t find this number to be particularly meaningful at this time of year.