In addition to evaluations of other charities, GiveWell publishes substantial evaluation of itself, from the quality of its research to its impact on donations. We publish quarterly updates regarding two key metrics: (a) donations to top charities and (b) web traffic.
The table and chart below present basic information about our growth in money moved and web traffic in the first half of 2014 (note 1).
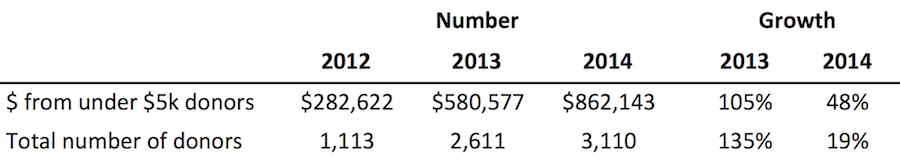
Growth in money moved, as measured by donations from donors giving less than $5,000 per year, slowed in the second quarter of 2014 compared with the first quarter, and was substantially weaker than growth in the first two quarters of 2013.
The total amount of money we move is driven by a relatively small number of large donors. These donors tend to give in December, and we don’t think we have accurate ways of predicting future large gifts (note 2). We therefore show growth among small donors, the portion of our money moved about which we think we have meaningful information at this point in the year.
We show web analytics data from two sources: Clicky and Google Analytics. The data on visitors to our website differs between the two sources. We do not know the cause of discrepancy (though a volunteer with a relevant technical background looked at the data for us to try to find the cause). Full data set available at this spreadsheet. (Note on how we count unique visitors.)
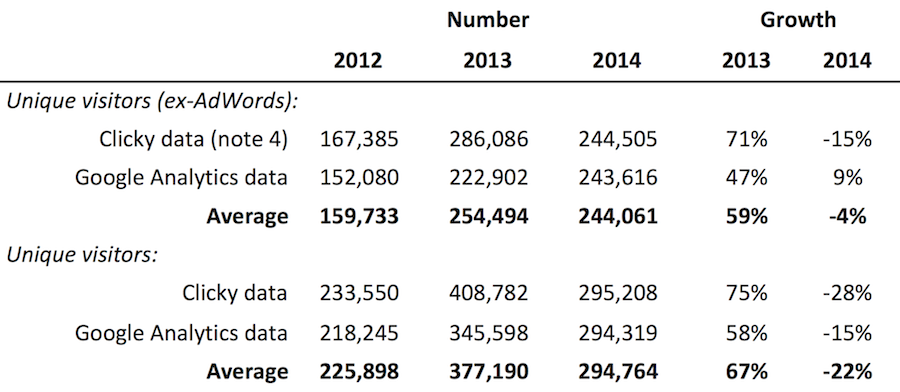
Traffic from AdWords decreased in the first two quarters because in early 2014 we removed ads on searches that we determined were not driving high quality traffic to our site (i.e. searches with very high bounce rates and very low pages per visit).
Data in the chart below is an average of Clicky and Google Analytics data, except for those months for which we only have data (or reliable data) from one source (see full data spreadsheet for details).
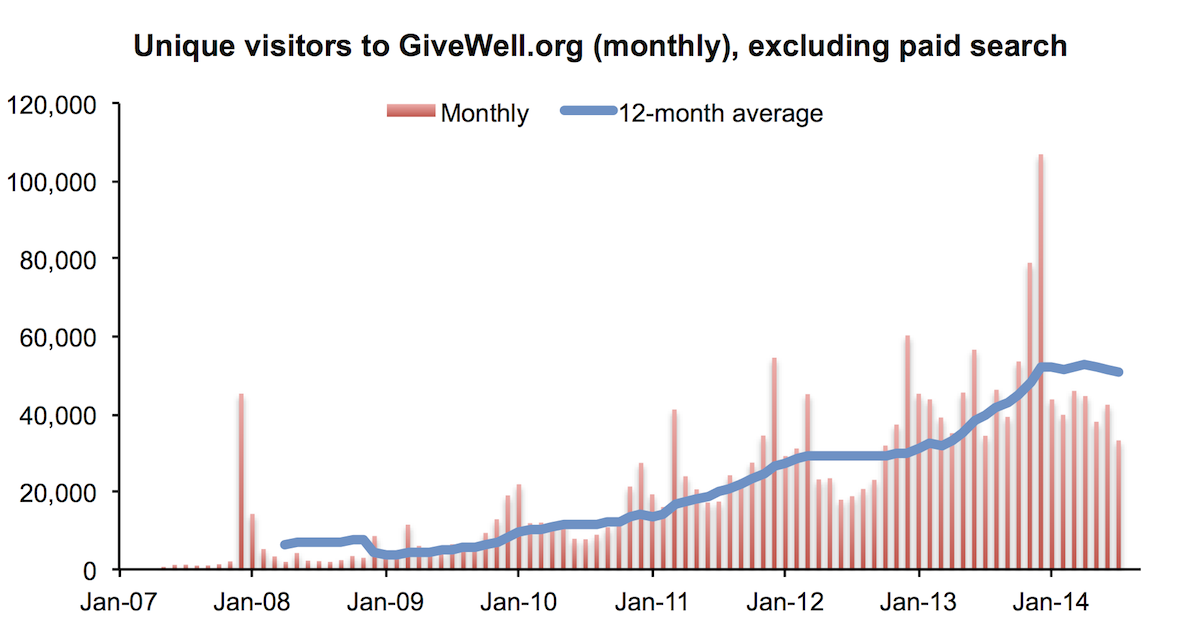
The above indicates that our growth slowed significantly in 2014 relative to last year (and previous years). It is possible that the numbers above are affected by the fact that (a) growth in the second quarter of 2013 was particularly strong due to a series of media mentions (as we previously noted) or (b) differences in the way that our recommended charities track donations (we would guess that this could explain a difference of a few hundred donors). Our guess is that both of these factors contribute but do not explain the slower growth.
Note 1: Since our 2012 annual metrics report we have shifted to a reporting year that starts on February 1, rather than January 1, in order to better capture year-on-year growth in the peak giving months of December and January. Therefore metrics for the “first two quarters” reported here are for February through July.
Note 2: In total, GiveWell donors have directed $2.41 million to our top charities this year, compared with $1.46 million at this point in 2013. For the reason described above, we don’t find this number to be particularly meaningful at this time of year.
Note 3: We count unique visitors over a period as the sum of monthly unique visitors. In other words, if the same person visits the site multiple times in a calendar month, they are counted once. If they visit in multiple months, they are counted once per month.
Google Analytics provides ‘unique visitors by traffic source’ while Clicky provides only ‘visitors by traffic source.’ For that reason, we primarily use Google Analytics data in the calculations of ‘unique visitors ex-AdWords’ for both the Clicky and Google Analytics rows of the table. See the full data spreadsheet, sheets Data and Summary, for details.