Before we start giving our answers to the questions of this post, I wanted to share some raw data that we look at to gauge how things are going.
The charts/tables below cover the following:
- “Money moved,” i.e., donations made to GiveWell-recommended charities due to GiveWell’s research
- Website traffic.
This is just a subset of the information we have. We’ll be releasing a more complete set of charts/tables/data shortly.
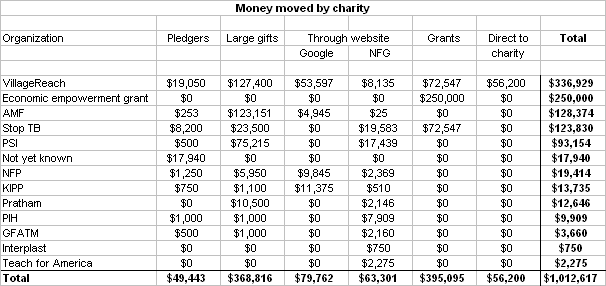
The table below shows the support each of our recommended charities received in 2009. Update, 1/8/2010: VillageReach sent us an updated file that includes donors through the end of 2009. The updated table is below. Note: VillageReach’s total fell as we discovered that we had erroneously double-counted some funds.

You can view the original table we posted here.
- “Pledgers” refers to people who made GiveWell Pledges (advance commitments to give based on our research) in 2008, before our recent report was completed, and followed through on these commitments in 2009.
- “Large gifts” refers to donors who made large gifts, and directly told us (and the charities they were giving to) that GiveWell’s research had been the key factor in where they gave.
- “Economic empowerment grant” refers to a grant made directly by GiveWell, with funds from a single donor.
- “Through website” refers to gifts made through the “Donate Now” buttons on GiveWell.net (some through Google and some through Network for Good (NFG)).
- “Grants” refers to grants made directly by GiveWell, mostly with funds that were restricted by donors for regranting (we also granted just under $15,000 in unrestricted funds).
- “Direct to charity” refers to donations that VillageReach received, not through GiveWell’s website, and believes it can confidently attribute to GiveWell (this is due to the fact that VillageReach is a relatively small organization that does not get many donations from unfamiliar individuals). We are still awaiting data from 12/22/09-12/31/09, so we expect the final version of this number be higher.
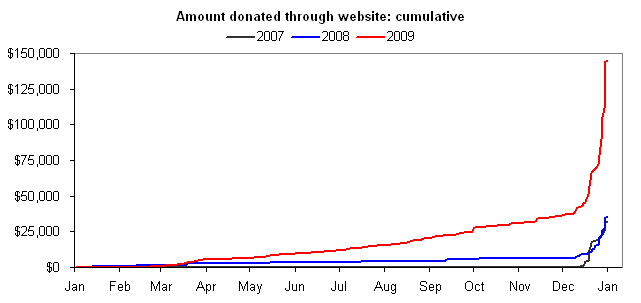
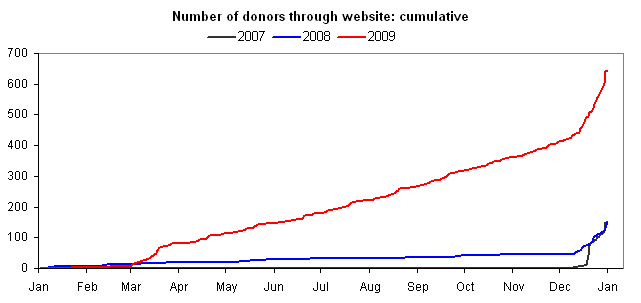
The following two charts show the amount donated and number of donors through the GiveWell site, comparing 2007-2009 (and the beginning of 2010).


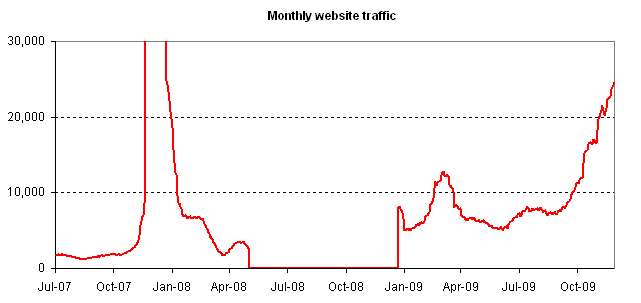
Finally, we show monthly web traffic to the GiveWell site and blog. Two notes: (1) we unfortunately lost tracking for much of 2008 — that explains the lack of data during that period. (2) We had an immense spike on 12/20/2007 due to media coverage; we’ve purposefully set the left-axis as it is to make it easier to view the rest of the chart.


Comments
congratulations. those are some nice trends.
I agree with razib.
I’m a little surprised to see that the GiveWell inspired donations to VillageReach seem much more frequent than GiveWell inspired donations to Stop TB in light of the fact that they are your two top ranked organizations. It would be interesting to know why. (I personally gave to VillageReach.)
Jonah, I also gave to VillageReach, but it could be as simple as that giving to VillageReach is a lot easier than giving to Stop TB as the former is a US-incorporated 501 (c) (3). Or it could be that GiveWell’s customers favor the cause of infant mortality to that of adult mortality.
I would guess that there’re three primary reasons for the difference. The first is “real”; the other two are due to issues with the data we have:
The updated table is:
You’ll note that the total amount given through NFG fell slightly. This is because sometimes visitors to NFG’s site come from GiveWell but give to a non-GiveWell-recommended charity. These were counted based on the aggregate NFG figure, but we’ve removed them now that we can identify that they are not due to our recommendations.
For the record, I donated $650 to PSI through PSI’s own website after reading about it here.
I’ve recently begun reading this website; it’s very interesting and informative and I agree that you’ve got some nice trends. In light of the media spike in 12/2007, have you guys thought of writing a book a la Freakonomics? It could really get your story out and I find that information, especially quantitative data, in print form is a lot easier to digest. Additionally, people who commit their time to reading a book are a lot more likely to commit to understanding your goals and investing time and money into GiveWell and its highly reviewed charities. Books, unlike short-term media coverage, last for a much longer time. And unlike a web blog, they can encompass much more information.
I was also very interested in your reviews of microfinance and the Grameen Foundation, mostly because Yunus makes a very compelling argument and it’s been highly publicized and seemed to me like a good idea at first. Have you guys looked into the impact or success likelihood of Yunus’s social business model? I would be interested in the social impact of his partnership with Danone yogurt company in Bangladesh (about it here: http://news.bbc.co.uk/2/hi/business/8100183.stm, an interesting viewpoint here: http://www.clearlyso.com/bangladesh/?p=79).
Erin, thanks for the thoughts.
Comments are closed.