In addition to evaluations of other charities, GiveWell publishes substantial evaluation on itself, from the quality of its research to its impact on donations. We publish quarterly updates regarding two key metrics: (a) donations to top charities and (b) web traffic.
The table and chart below present basic information about our growth in money moved and web traffic in the first quarter of 2013 (note 1).
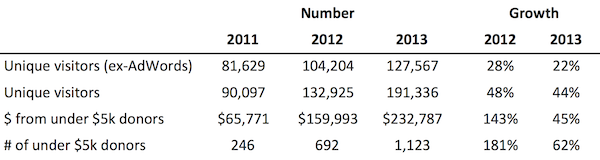
Growth is at a slower pace than in 2012 (note 2). This may largely be a function of the fact that we are now growing from a larger base from which we can no longer expect percentage increases of the scale we’ve had in the past. Another possibility is that we’re reaching a “saturation point” and growth will now slow significantly. Our arithmetic growth has slowed slightly over the past year, though it is roughly consistent with what it was at this point last year; this is especially true when we consider changes in our ability to measure donations each year.
We believe that some of the apparent slowing in money moved growth is due to better measurement in 2012 than in either 2011 or 2013. We are able to most completely and quickly track donations that (a) go to GiveWell for the support of our top charities; or (b) go directly to AMF (AMF asks donors at the time of donation whether they gave due to GiveWell and immediately makes that information available to us). In early 2011, the majority of donations went directly to VillageReach. In early 2012, the majority of donations went to AMF and to GiveWell for the support of SCI; we were able to track all of these donations when they were given. In early 2013, we had a third charity, GiveDirectly, receiving (we believe) a significant portion of donations directly.
A caveat to all of the above is that this is based solely on small donors. While in the past we’ve seen that growth in small donors earlier in the year provides an indication of overall growth at the end of the year, because a significant proportion of our money moved comes from a relatively small set of large donors, we don’t place significant weight on this projection.
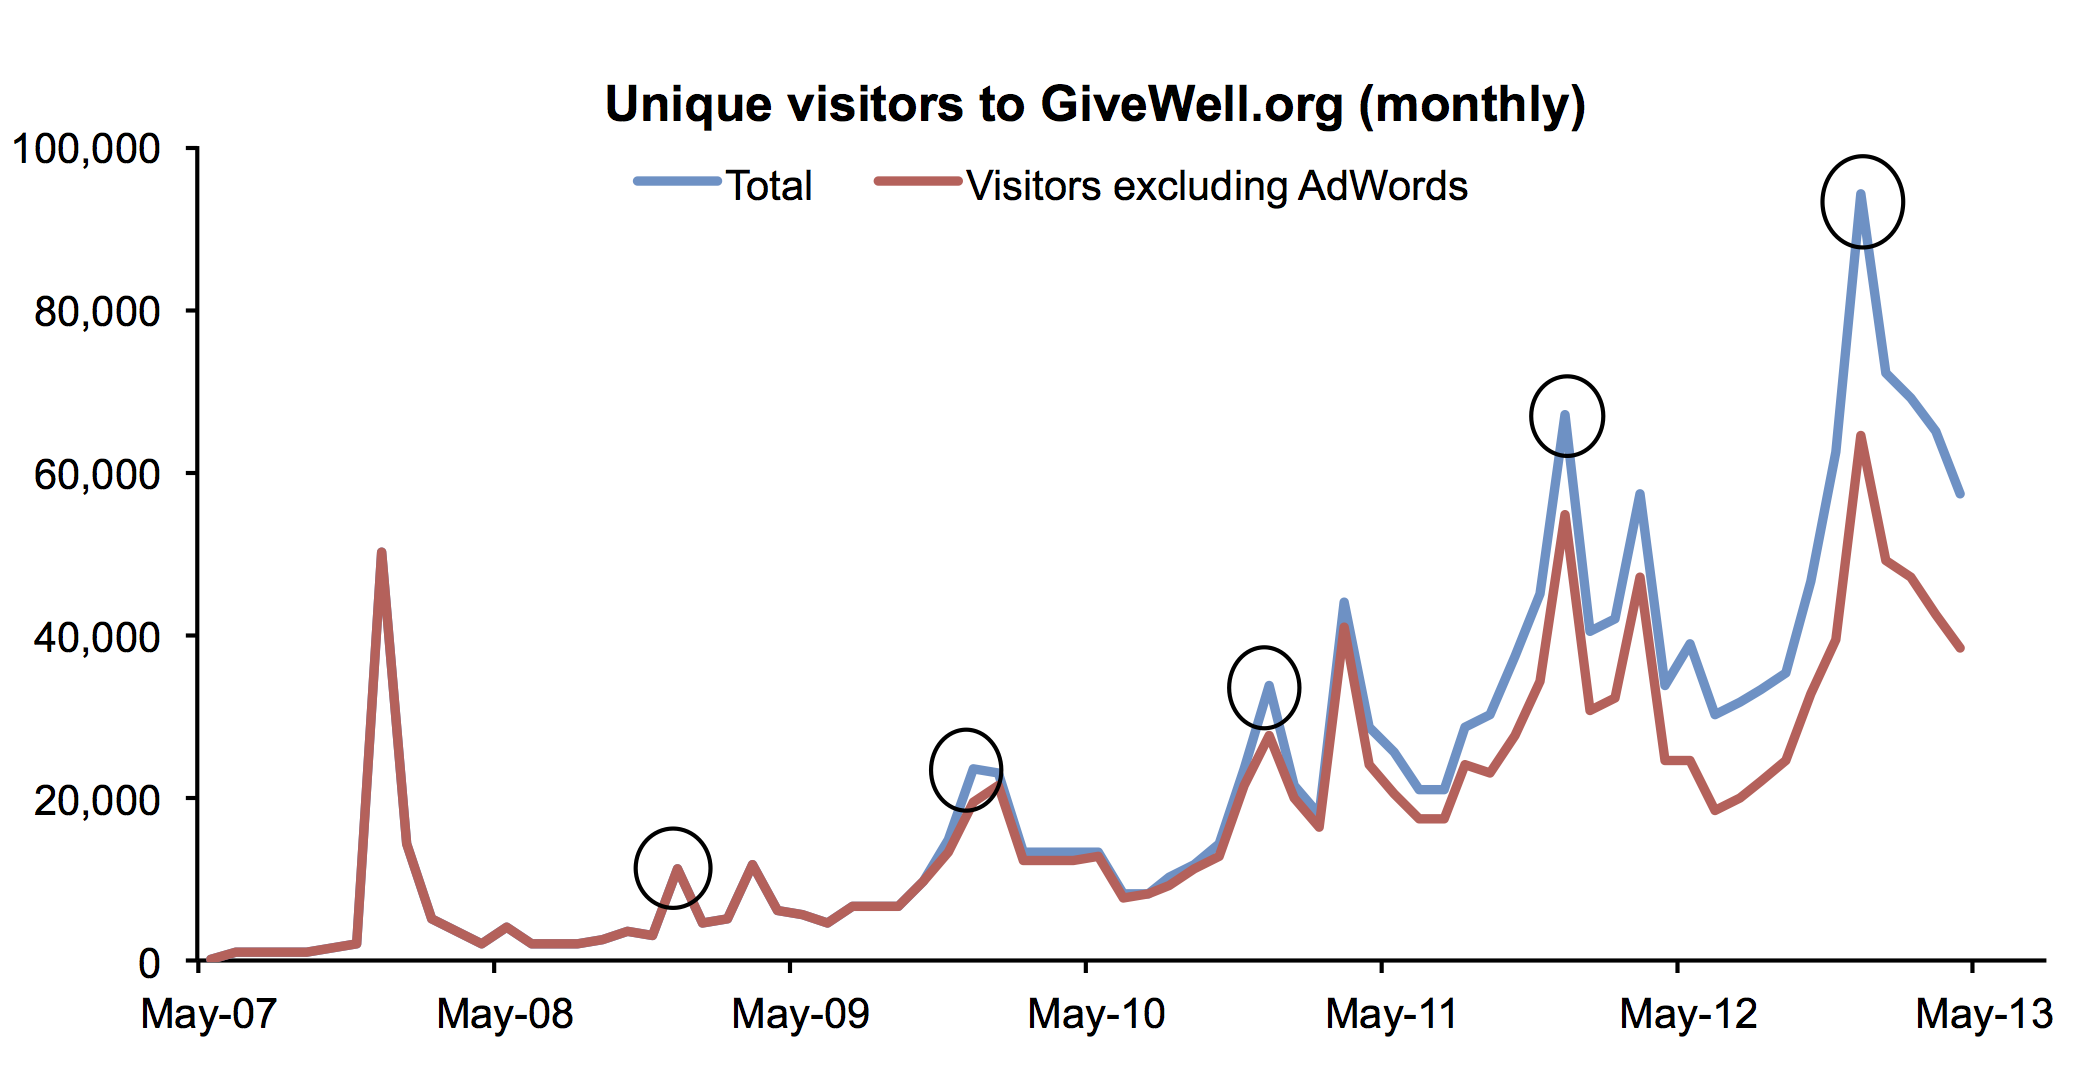
Website traffic tends to peak in December of each year (circled in the chart below). Growth in web traffic has generally remained strong in 2013.
Note 1: Since our 2012 annual metrics report we have shifted to a reporting year that starts on February 1, rather than January 1, in order to better capture year-on-year growth in the peak giving months of December and January. Therefore metrics for the first quarter of 2013 reported below are for February through April.
Note 2: The majority of the funds GiveWell moves come from a relatively small number donors giving larger gifts. These larger donors tend to give in December, and we have found that, in past years, growth in donations from smaller donors throughout the year has provided a reasonable estimate of the growth from the larger donors by the end of the year.
In total, GiveWell donors have directed $604,862 to our top charities this year, compared with $555,749 at this point in 2012. For the reason described, we don’t find this number to be particularly meaningful at this time of year.
Comments
There is no miracle or luck to riches
must work and use the wisdom in order to improve the knowledge and use this to your advantage, greater wealth of wisdom is knowing how to use your business strategies and service certainly will succeed gradual
and can therefore get material wealth!
Comments are closed.