In addition to evaluations of other charities, GiveWell publishes substantial evaluation of ourselves, from progress against our goals to our impact on donations. We generally publish quarterly updates regarding two key metrics: (a) donations to top charities and (b) web traffic (though going forward, we may provide less frequent updates).
The tables and chart below present basic information about our growth in money moved and web traffic in the first quarter of 2016 compared to the previous two years (note 1).
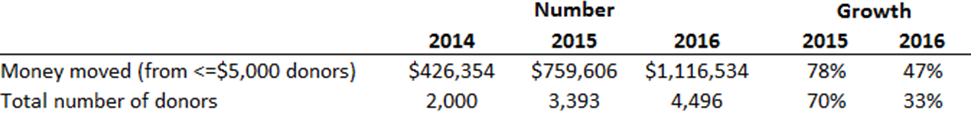
Money moved by donors who have never given more than $5,000 in a year increased about 50% to $1.1 million. The total number of donors in the first quarter increased about 30% to about 4,500 (note 2).
Most of our money moved is donated near the end of the year (we tracked 70% or more of our total money moved in the fourth quarter each of the last three years) and is driven by a relatively small number of large donors. Because of this, we do not think we can reliably predict our growth and think that our year-to-date total money moved provides relatively limited information about what our year-end money moved is likely to be (note 3). We therefore look at the data above as an indication of growth in our audience.
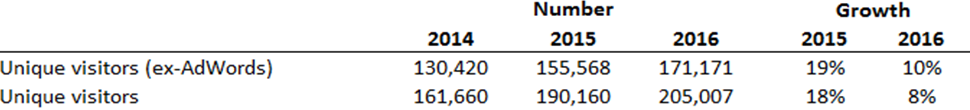
Growth in web traffic excluding Google AdWords increased 10% in the first quarter. GiveWell’s website receives elevated web traffic during “giving season” around December of each year. To adjust for this and emphasize the trend, the chart below shows the rolling sum of unique visitors over the previous twelve months, starting in December 2009 (the first period for which we have 12 months of reliable data due to an issue tracking visits in 2008).
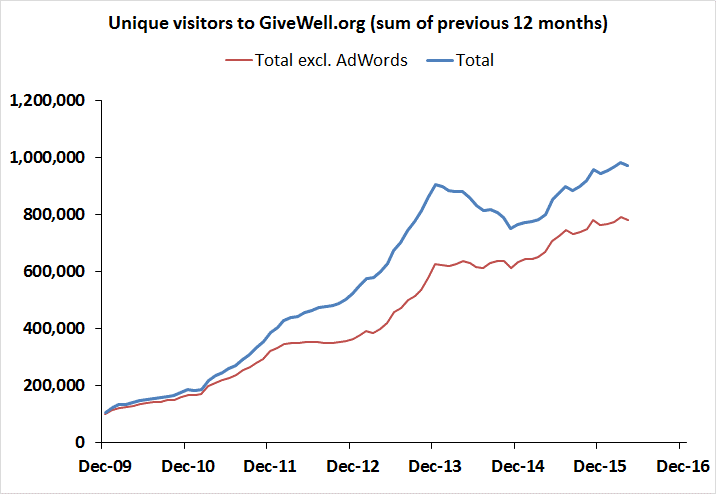
We use web analytics data from two sources: Clicky and Google Analytics (except for those months for which we only have reliable data from one source). The raw data we used to generate the chart and table above (as well as notes on the issues we’ve had and adjustments we’ve made) is in this spreadsheet. (Note on how we count unique visitors.)
Note 1: Since our 2012 annual metrics report we have shifted to a reporting year that starts on February 1, rather than January 1, in order to better capture year-on-year growth in the peak giving months of December and January. Therefore, metrics for the “first quarter” reported here are for February through April.
Note 2: Our measure of the total number of donors may overestimate the true number. We identify individual donors based on the reported name and email. Donors may donate directly to our recommended charities and not opt to share their contact information with us, or donors may use different information for subsequent donations (for example, a different email), in which case, we may mistakenly count a donation from a past donor as if it was made by a new donor. We are unsure but would guess that the impact of this issue is relatively small and that the data shown are generally reflective of our growth from year to year.
Note 3: In total, GiveWell donors directed $2.6 million to our top charities in the first quarter of 2016, compared to $2.0 million that we had tracked in the first quarter of 2015. For the reason described above, we don’t find this number to be particularly meaningful at this time of year.
Note 4: We count unique visitors over a period as the sum of monthly unique visitors. In other words, if the same person visits the site multiple times in a calendar month, they are counted once. If they visit in multiple months, they are counted once per month.
Comments
Thanks for this update. I noticed that for pageviews, while the ‘sum of previous 12 months’ pageviews has increased since 2015, that comparing month-for-month between 2015 and 2016 shows that the 2016 pageviews are lower by about 10,000 to 40,000 per month between April and June. April to June of 2016 is also lower relative to previous months of 2016. I was wondering if you had any thoughts on the reasons for this, although I realize that only April falls within this Q1 review.
Issa – We have not thought carefully about the observations you’ve made. Despite the comparisons you highlighted, the web traffic in recent months seems generally in line with the longer term patterns. It’s also possible that the comparison to the same months last year is skewed by additional press about effective altruism around May 2015.
In our last quarterly metrics update, we said we might provide less frequent updates going forward. We’ve now decided to discontinue quarterly metrics posts. We expect that our next metrics update will be our 2016 metrics report which we expect to publish in 2017.
Thanks for the clarification, Natalie! That’s a bit unfortunate for me, since I really appreciate reading the quarterly reports, but I’m sure you’ve made a thoughtful decision based on how you can allocate your existing resources and the overall demand for the quarterly reports.
It appears that GiveWell does not full utilize the Adwords grant from Google. I remember reading some other updates that mention some Adwords traffic had high bounce rates and were therefore eliminated. However, since the Adwords traffic comes at no cost is there a logic behind not fully utilizing the budget to maximize traffic – even if it means some of the traffic will bounce out?
Hi Matthew—
We do occasionally use our full AdWords budget. We decided that closely managing our AdWords account such that we were more consistently hitting our budget maximum isn’t worth the risk of replacing this high-performing traffic with extremely low-performing traffic at other times.
That makes a lot of sense. However, by maximizing the budget for just 2 out of 6 months you could be eligible for Grantspro, which would increase the monthly budget from $10k to $40k. With the increased allocation not only would you be able to keep focus on maximizing the high-performing traffic, but capture visitors that might be on the fence.
Hi Matthew—
Thanks for following up. We already use Grantspro, and always exceed the $10k minimum; we just don’t always hit the $40k maximum.
Comments are closed.