GiveWell is dedicated to finding outstanding giving opportunities and publishing the full details of our analysis. In addition to evaluations of other charities, we publish substantial evaluation of our own work. This post lays out highlights from our 2017 metrics report, which reviews what we know about how our research impacted donors. Please note:
- We report on “metrics years” that run from February through January; for example, our 2017 data cover February 1, 2017 through January 31, 2018.
- We differentiate between our traditional charity recommendations and the work of the Open Philanthropy Project, which became a separate organization in 2017 and whose work we exclude from this report.
- More context on the relationships between GiveWell, Good Ventures, and the Open Philanthropy Project can be found here.
Summary of influence: In 2017, GiveWell influenced charitable giving in several ways. The following table summarizes our understanding of this influence.
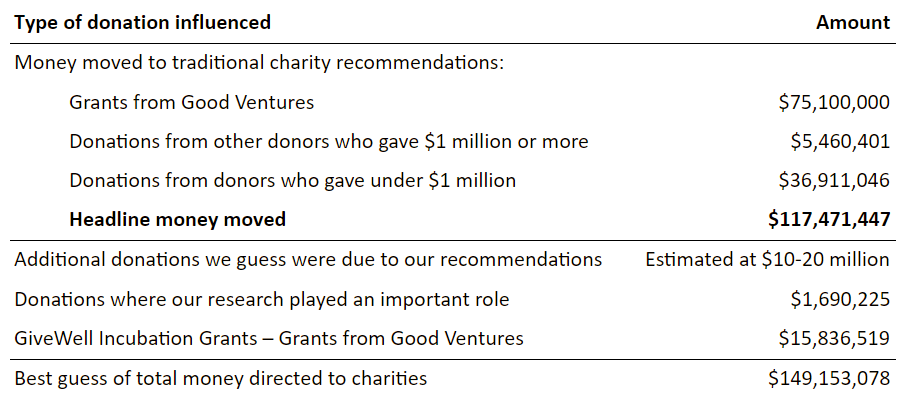
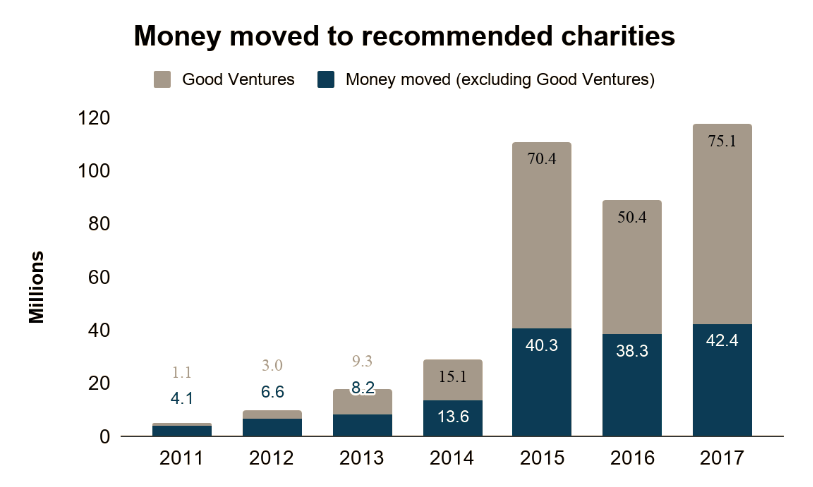
Headline money moved: In 2017, we tracked $117.5 million in money moved to our recommended charities. Our money moved only includes donations that we are confident were influenced by our recommendations.
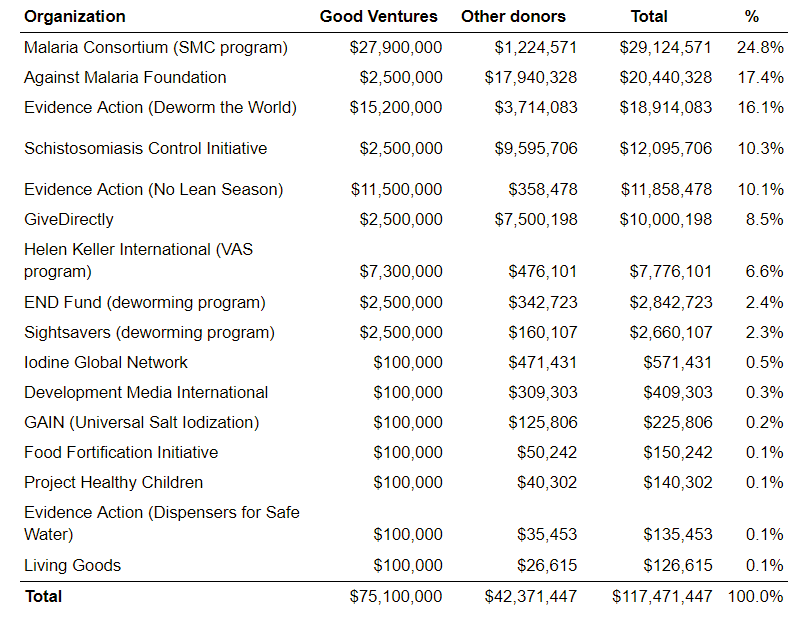
Money moved by charity: Our nine top charities received the majority of our money moved. Our seven standout charities received a total of $1.8 million.
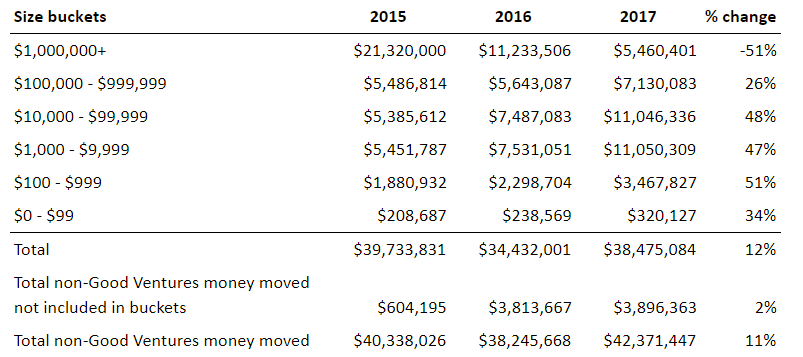
Money moved by size of donor: In 2017, the number of donors and amount donated increased across each donor size category, with the notable exception of donations from donors giving $1,000,000 or more. In 2017, 90% of our money moved (excluding Good Ventures) came from 20% of our donors, who gave $1,000 or more.
Donor retention: The total number of donors who gave to our recommended charities or to GiveWell unrestricted increased about 29% year-over-year to 23,049 in 2017. This included 14,653 donors who gave for the first time. Among all donors who gave in the previous year, about 42% gave again in 2017, up from about 35% who gave again in 2016.
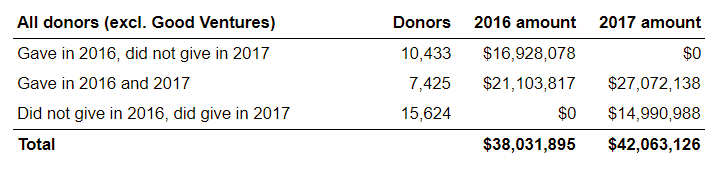
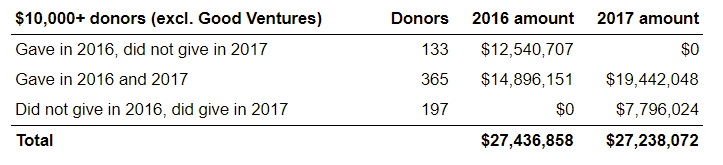
Our retention was stronger among donors who gave larger amounts or who first gave to our recommendations prior to 2015. Of larger donors (those who gave $10,000 or more in either of the last two years), about 73% who gave in 2016 gave again in 2017.
GiveWell’s expenses: GiveWell’s total operating expenses in 2017 were $4.6 million. Our expenses decreased from about $5.5 million in 2016 due to the Open Philanthropy Project becoming a separate organization in June 2017. We estimate that 67% of our total expenses ($3.1 million) supported our traditional top charity work and about 33% supported the Open Philanthropy Project. In 2016, we estimated that expenses for our traditional top charity work were about $2.0 million.
Donations supporting GiveWell’s operations: GiveWell raised $5.7 million in unrestricted funding (which we use to support our operations) in 2017, compared to $5.6 million in 2016. Our major institutional supporters and the six largest individual donors contributed about 49% of GiveWell’s operational funding in 2017.
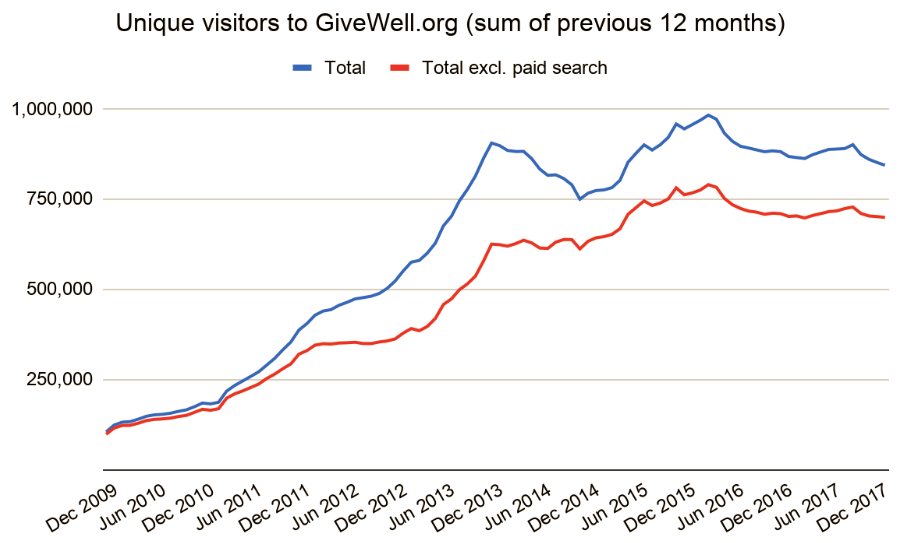
Web traffic: The number of unique visitors to our website remained flat in 2017 compared to 2016 (when excluding visitors driven by AdWords, Google’s online advertising product).
For more detail, see our full metrics report (PDF).
Comments
What’s the $3.9M of non-GV “money not included in buckets”?
I guess this must be money you can track, yet are not sure of the breakdown into individual donations. But what typically causes that? Maybe some charities report GiveWell-driven totals to you, but without the breakdown? Or what?
How are GiveWell’s discretionary regrants, cf. https://www.givewell.org/about/FAQ/discretionary-grantmaking accounted for in the money moved calculation? It seems they aren’t included in the Good Ventures column. Do they go in the Other donors column, or are they excluded?
I would find it helpful to include a separate column for GiveWell discretionary regranting.
For Helen Keller International, this post says the amount donated by Good Ventures is $7.3 million, but the amount I see at https://blog.givewell.org/2017/11/27/our-top-charities-for-giving-season-2017/ and http://www.goodventures.org/our-portfolio/grants/helen-keller-international-vitamin-a-supplementation
Is this a result of different rounding methods or currency conversions, or was there another $100,000 grant to Helen Keller International that makes up the difference?
Colin – Some GiveWell-recommended charities and effective altruism groups provided us with lists of anonymized donations that were influenced by our research. Because we don’t know how much was given in total to our recommended charities by the donors who made these donations (because we cannot match donations with individuals), we exclude them from the “Money moved by size of donor” table.
Vipul – The donations totaled on our discretionary grantmaking page are from donors other than Good Ventures, who chose the option to give to “Grants to recommended charities at GiveWell’s discretion” when they made a donation to GiveWell. These are included in the “Headline money moved” total. In the “Money moved by charity” table, they are included in the total for the charity that we allocated the discretionary funds to.
Vipul – The $7.3 million total from Good Ventures to Helen Keller International includes a participation grant of $100,000 and a further grant of $7.2 million.
Is the flat level of web trafic a concern? Is there any potential causes for this?
Thanks for your great work.
Liam –
We don’t know what the cause of flattening web traffic might be. Given the continued growth in donations from donors giving less than $100,000 per year (data in “Money moved by size of donor” section above), the flattening web traffic has not been a major concern, though may indicate room for improvement. Ben Bateman recently joined our team as Head of Growth and he plans to look more deeply at our web traffic data to understand how we might be able to make improvements and drive more donations to our top charities.
More thoughts on our plans for outreach in 2018 can be found in this post.
Comments are closed.