GiveWell is dedicated to finding outstanding giving opportunities and publishing the full details of our analysis. In addition to evaluations of other charities, we publish substantial evaluation of our own work. This post lays out highlights from our 2018 metrics report, which reviews what we know about how our research impacted donors. Please note:
- We report on “metrics years” that run from February through January; for example, our 2018 data cover February 1, 2018 through January 31, 2019.
- In an effort to present a more comprehensive measure of our influence on charitable giving, this year’s metrics report includes GiveWell Incubation Grants in our headline “money moved” figure. In previous reports we have excluded Incubation Grants from this figure.
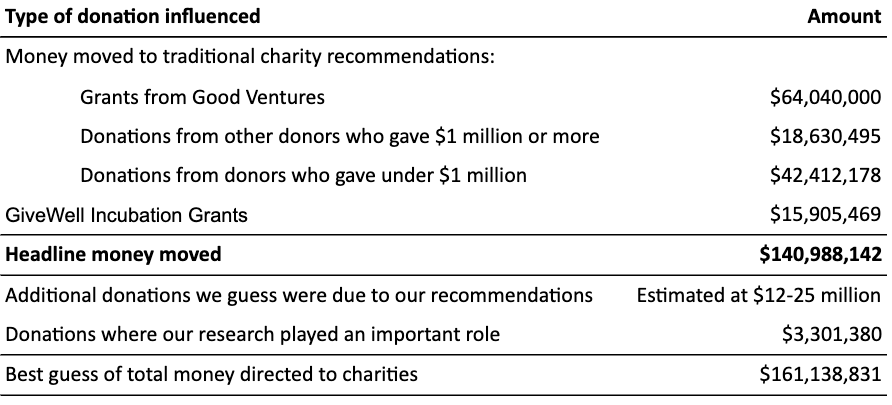
Summary of influence: In 2018, GiveWell influenced charitable giving in several ways. The following table summarizes our understanding of this influence.

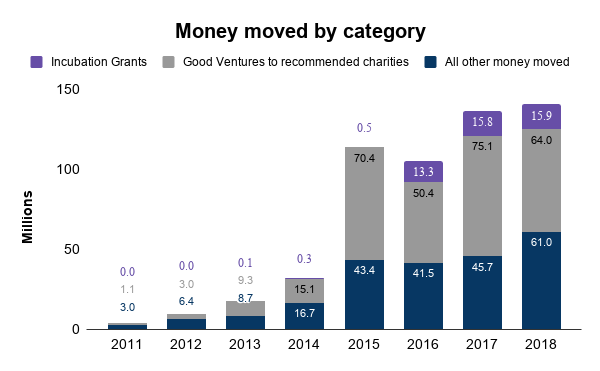
Headline money moved: In 2018, we tracked $141 million in money moved to our recommended charities and via our Incubation Grants program. Our money moved only includes donations that we are confident were influenced by our recommendations.

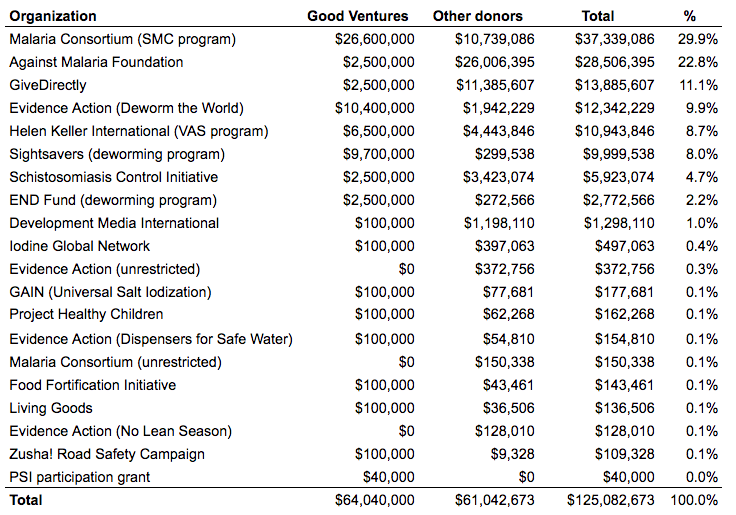
Money moved by charity: Our nine top charities, including Evidence Action’s No Lean Season which is no longer a top charity, received the majority of our money moved. Our eight standout charities received a total of $2.7 million. We also tracked $0.5 million in unrestricted donations to organizations that run programs we recommend and $15.9 million in Incubation Grants.

Money moved by size of donor: We have less reliable data on individual donors in 2018 than in previous years, primarily as a result of new European privacy regulations that have led some of our recommended charities to share less detailed data with us. We have estimated the number of donors in each size category we track. We estimate that the number of donors in most categories was roughly unchanged compared to 2017 and that the amount of money in most categories increased slightly. Notably, we saw a large increase in the amount donated from donors giving $1 million or more. In 2018, we estimate that 92% of our money moved (excluding Good Ventures) came from the 20% of our donors who gave $1,000 or more. Details on how we produced these estimates are available in the full report.
_2018.png)
_2018.png)
GiveWell’s expenses: GiveWell’s total operating expenses in 2018 were $4.3 million.
Donations supporting GiveWell’s operations: GiveWell raised $12.4 million in unrestricted funding (which we mostly use to support our operations) in 2018, compared to $5.7 million in 2017. The eleven largest individual donors, plus Good Ventures, contributed 67% of GiveWell’s operational funding in 2018.
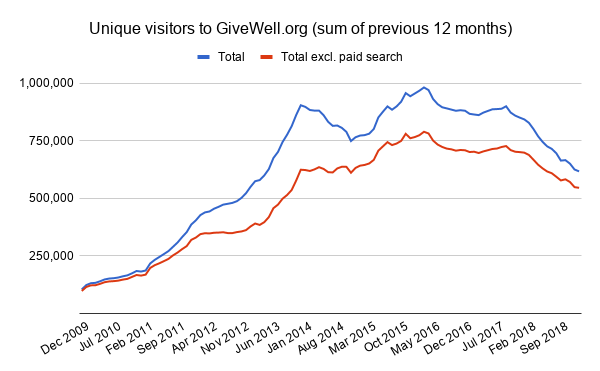
Web traffic: The number of unique visitors to our website declined 22% in 2018 compared to 2017 (when excluding visitors driven by AdWords, Google’s online advertising product).

For more detail, see our full metrics report (PDF).

Comments
Are you worried about the steep decline in traffic?
Any thoughts as to why it’s happened?
Thanks for the questions, Sam.
We are disappointed by the decline in site traffic, but not yet worried for the primary reason that the decline in traffic appears not to have negatively impacted our influence on charitable giving. This suggests that site visitors are not necessarily always the same people as donors; we’ve been able to drive additional donations, including from new donors, despite the decline in site visitors. In addition, GiveWell has not invested heavily in advertising or marketing in the past. To date, most of our growth has been due to word of mouth and other forms of earned media. We think that as we invest more in marketing and outreach, we will likely reverse the negative trend in site traffic.
I don’t have a great explanation for the decline in traffic. We have not prioritized doing the analysis that might help us answer this question better because website traffic hasn’t been the top priority of our relatively new growth and outreach teams so far. I’d personally guess that some portion of the decline is due to a decrease in media coverage by major outlets in recent years, but wouldn’t strongly stand behind that conjecture.
Although growing our web traffic hasn’t been a key priority to date, we do think that in the long term, increased website traffic will be necessary in order to meet our goals of increasing the amount of funding we direct to our top charities. GiveWell is in the early stages of building capacity to grow our audience, such as experimenting in how we communicate about GiveWell and hiring for new outreach roles. We hope to hire a Vice President of Marketing by the end of 2019. As part of our efforts to bring more traffic to the website in the future, we are planning to spend more money this year on SEO and advertising. We think that these efforts will help us increase site traffic and convert more site visitors into donors by improving the user experience and the intelligibility of our research.
Hi Devin,
Thanks for the detailed response. Looking more carefully, I think I have a pretty good idea of what caused the drop off in traffic: 2015-2016 was when the Open Philanthropy Project split from GiveWell and Holden and others stopped posting as much on the blog.
The decline in traffic seems to be related to a loss in–I hate using this term–“thought leadership”. The blog has become less informative over time. I think Elie or someone else has to step up and write more frequently on the advances you are making.
Sam
Good morning
I loved reading about you, greetings from Venezuela.
I would like to know more about your work. I am currently working in an educational organization that needs help to remodel your spaces.
But my country suffers from an international blockage in bank accounts, we would like to know more about your services
Atte
Erika Rodriguez
Hi Erika,
Great to hear from you! Please get in touch with us at info@givewell.org.
Devin
Congratulations on the progress!
The email from Elie that sent me to this post contained the following sentence:
“Based on our impact estimates, we expect that donations from 2018 will prevent over 30,000 deaths, provide parasitic worm treatments for over 70 million children, and deliver unconditional cash transfers to over 10,000 families.”
This is, in my opinion, the most exciting part of GiveWell’s progress, and I think it’s worth including information about the estimated impact in the blog post itself.
Thanks Jake!
I appreciate the thoughtful suggestion and am glad the recent email resonated with you.
I agree that the most exciting implication of GiveWell’s growth is the impact it has on people. I think the idea of including this information in the annual metrics report is a good one and worth considering seriously, though I can’t be sure GiveWell will decide to expand the scope of this annual post.
GiveWell has been working on highlighting the impact of our work more explicitly in emails (such as the one you received) as well as on our website and your suggestion seems to fit with the overall direction we’re taking with our content.
I wouldn’t be surprised if we ultimately decide to leave the annual metrics report format as is, but I expect we will have more to say about the impact of our donors’ giving in coming months and years.
Devin
Comments are closed.