GiveWell is dedicated to finding outstanding giving opportunities and publishing the full details of our analysis. In addition to evaluations of other charities, we publish substantial evaluation of our own work. This post lays out highlights from our 2018 metrics report, which reviews what we know about how our research impacted donors. Please note:
- We report on “metrics years” that run from February through January; for example, our 2018 data cover February 1, 2018 through January 31, 2019.
- In an effort to present a more comprehensive measure of our influence on charitable giving, this year’s metrics report includes GiveWell Incubation Grants in our headline “money moved” figure. In previous reports we have excluded Incubation Grants from this figure.
Summary of influence: In 2018, GiveWell influenced charitable giving in several ways. The following table summarizes our understanding of this influence.
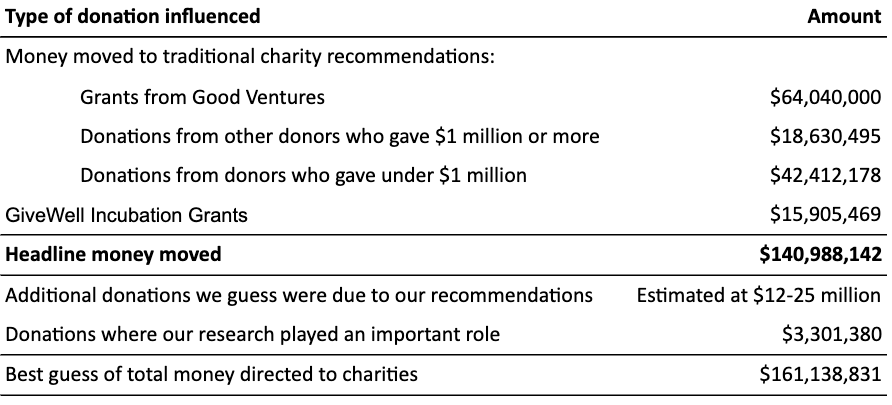
Headline money moved: In 2018, we tracked $141 million in money moved to our recommended charities and via our Incubation Grants program. Our money moved only includes donations that we are confident were influenced by our recommendations.