The GiveWell Blog

Reflecting on our progress in 2019

GiveWell grew significantly in 2019. We hired 13 full-time staff members, bringing our total size to 37, and expanded our ability to take on new projects across domains. We feel positioned to do more and better work going forward as a result.

We see a strong indication that the amount of funding we directed to our recommended charities increased last year, too. While we haven’t reconciled all giving from 2019, the value of donations we processed increased by about 30% in 2019.

We’re proud of what we accomplished in 2019. We also fell short of some goals last year. Most notably, we failed to make as much progress as we planned in researching new areas of global health and poverty alleviation.

This blog post provides a brief look at our key successes and failures last year. A more detailed accounting of how our progress in 2019 compared to the goals we set is available on this page.

Read More

How did we do in 2019? A preliminary look at our growth.

We see an early indication that GiveWell continued its trajectory of robust donor growth last year. The total value of donations processed by GiveWell increased 30% in 2019.[1]

We’re sharing this data now because we believe it is an informative early update about our growth last year. However, GiveWell-processed donations don’t tell the full story of our impact. Many donors who rely on our research give via our partner organizations or directly to our top charities. Their gifts account for the majority of donations due to our work and are not processed by GiveWell. Information about these gifts is time-consuming to gather and has usually led us to release our metrics data many months after the end of the year. We plan to release a complete 2019 metrics report and assessment of our impact, including donations not processed by GiveWell, later this year.

Here’s what we know so far, based on the nearly complete information we have about donations we processed:

  • We processed $54.1 million in donations in 2019. Sixty-five percent of this amount was restricted to our recommended charities and 35% was unrestricted, which we may use to support GiveWell’s operations.
  • Support from donors giving $10,000 to $100,000 comprised the largest proportion of our growth (35%).[2]
  • Returning donors who gave more than last year made up 75% of our growth in funds donated (excluding anonymous donations).[3]
  • We believe that the majority of our growth was organic and would have occurred without any outreach and marketing efforts from GiveWell, although we can attribute some to specific outreach and marketing initiatives.[4]

We’re encouraged by this growth and excited to write about it. We also discuss below some ways that GiveWell-processed donations could be a misleading indicator of our overall impact.

Read More

GiveWell’s money moved and web traffic in 2018

GiveWell is dedicated to finding outstanding giving opportunities and publishing the full details of our analysis. In addition to evaluations of other charities, we publish substantial evaluation of our own work. This post lays out highlights from our 2018 metrics report, which reviews what we know about how our research impacted donors. Please note:

  • We report on “metrics years” that run from February through January; for example, our 2018 data cover February 1, 2018 through January 31, 2019.
  • In an effort to present a more comprehensive measure of our influence on charitable giving, this year’s metrics report includes GiveWell Incubation Grants in our headline “money moved” figure. In previous reports we have excluded Incubation Grants from this figure.

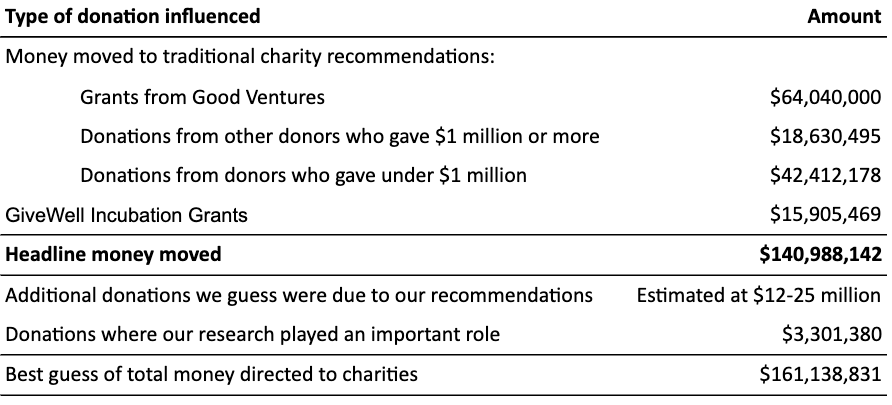
Summary of influence: In 2018, GiveWell influenced charitable giving in several ways. The following table summarizes our understanding of this influence.

Headline money moved: In 2018, we tracked $141 million in money moved to our recommended charities and via our Incubation Grants program. Our money moved only includes donations that we are confident were influenced by our recommendations.

Read More

GiveWell’s plans for 2019

Our top priorities this year support our goals to (a) increase the impact per dollar of the funds we direct and (b) increase our money moved. In 2019, we are focused on:

  • Building research capacity. (More)
  • Experimenting with approaches to outreach to find ones that we can scalably use to drive additional money moved. (More)
  • Exploring new areas of research. (More)
  • Improving GiveWell’s organizational strength. (More)
  • Ongoing research. (More)

Read More

Review of GiveWell’s work in 2018

2018 was a successful year for GiveWell. We achieved most of our goals and our money moved (donations made to our recommended charities due our research) increased significantly.

Each year, we look back at the goals we set the previous year and reflect on how our progress compared to our expectations.

This post will briefly discuss our key achievements and failures in 2018. We describe in detail our progress on the goals we outlined in 2018 here.

In 2018, we:

  • Directed an estimated $65 million in donations to our top charities, not including the contributions of Good Ventures, a large foundation with which we work closely.
  • Added senior hires in operations and outreach: a Director of Operations (Whitney Shinkle) and Head of Growth (Ben Bateman). We expect Whitney and Ben to make major contributions to our work in these domains.
  • Continued to improve and expand our core research product, completing new intervention reports, deepening our analysis for several key inputs into our cost-effectiveness model, and providing more transparent explanations for how we decided to allocate funds between top charities.

Read More

GiveWell’s money moved and web traffic in 2017

GiveWell is dedicated to finding outstanding giving opportunities and publishing the full details of our analysis. In addition to evaluations of other charities, we publish substantial evaluation of our own work. This post lays out highlights from our 2017 metrics report, which reviews what we know about how our research impacted donors. Please note:

  • We report on “metrics years” that run from February through January; for example, our 2017 data cover February 1, 2017 through January 31, 2018.
  • We differentiate between our traditional charity recommendations and the work of the Open Philanthropy Project, which became a separate organization in 2017 and whose work we exclude from this report.
  • More context on the relationships between GiveWell, Good Ventures, and the Open Philanthropy Project can be found here.

Summary of influence: In 2017, GiveWell influenced charitable giving in several ways. The following table summarizes our understanding of this influence.

Read More