The Money for Good study examined the size of the potential audience for work like GiveWell’s. What we’d like to see next would be a study on the nature of this audience: what sort of donor is open to giving based on third-party research? How do they think, what sorts of causes are they interested in, and where can they be found?
We don’t have the resources for a large-scale study on this topic, but in the absence of this, we thought it would be worthwhile to share our impressions from interacting with our own “customer donors,” i.e., people who use GiveWell to decide where to give. Because our money moved is somewhat “top heavy” (the bulk of the money comes from a relatively small number of relatively large donors), we have had in-depth conversations and formed informal relationships with people accounting for a large chunk of our influence. Some of the things we’ve found out about GiveWell customers have surprised us and led to changes in strategy; below we discuss the general impressions we’ve gotten.
- Attitudes toward evidence seem less key than we would have guessed. When we started GiveWell, we and most of our supporters imagined that new customers could be found in certain industries where people are accustomed to using measurement to evaluate and learn from their decisions. We hoped these people would resonate with our desire to bring feedback loops into areas where feedback loops don’t naturally exist. But we’ve found that a lot of them don’t, largely because impact isn’t the main thing they’re aiming for when they give. People give for many reasons – to maintain friendships, to overcome guilt and cognitive dissonance, to achieve recognition – and a given donor is unlikely to be interested in GiveWell unless achieving impact is at the top of his/her list.
- Moral and spiritual values seem more key than we would have guessed. Several of our major “customer donors” see their giving as fulfilling religious imperatives to help others. Many others have backgrounds in philosophy and deep interests in secular moral systems. What these two groups have in common, in my view, is serious investment in abstract principles of morality – principles that tell them it is as worthwhile to help people they’ll never meet as it is to help those in their community.
- GiveWell customers tend to be cause-agnostic and/or aligned with our views on the most promising philanthropic causes. We discussed this phenomenon in early 2011; it’s been one of the major surprises for us. We initially anticipated that many donors would agree with our basic approach to research, but would have strong disagreements with us on which causes to support, and that we would thus have to research a lot of different causes to serve them. That hasn’t turned out to be the case: most people tend to be either fully aligned with our approach to giving (including issue-agnosticism and a preference to help the poorest people, even if they’re overseas) or not aligned at all.
- GiveWell customers tend to be busy with non-philanthropic pursuits. People who spend all their time on philanthropy generally have their own relationships, convictions based on personal observation, etc. The people most likely to use our research are the ones who don’t have time to do their own. While not surprising, this phenomenon has made it somewhat difficult for us to get thoughtful, meaningful feedback on our research despite our efforts to make it transparent. That’s led us to experiment with more ways to solicit feedback, including formal evaluations, our public email group, summaries of our views on key topics posted to this blog, and (in progress) a possible in-person meeting to discuss our research with any “customer donors” who want to attend.
- GiveWell customers don’t tend to be friends with each other; it’s been very hard to find “clusters” of them. Most of our customers have had little success interesting their friends in us. We’ve found very little in the way of particular industries or social groups filled with GiveWell customers; instead, it seems that for every twenty people we talk to in any setting, one or two will become a customer. It’s thus not surprising that one of our top sources of referrals is Google: people tend to find us more than we find them.The major exception is that we seem to get disproportionate interest from fans of Peter Singer.
- Some of GiveWell’s donors are very young (considering how much they give) and very few are retired. This has implications for the future of GiveWell’s influence: the money we’re moving now is mostly coming from people whose peak giving years are yet to come.
- GiveWell customers never seem interested in public recognition. In our first year, we considered posting acknowledgements to major supporters on our website, but there was no interest. Since then, we have had many customers who require anonymity (even when we ask them to take public credit for our sake) and no customers who’ve requested that we publicly thank them or otherwise help them get recognition.
In my view, the last point is most consistent and most interesting. GiveWell customers have many reasons for giving – some religious, some secular – but they all revolve around achieving an impact for others rather than around getting any direct personal benefit (whether social, reputational or emotional). GiveWell customers are the kind of people who give when no one is watching, and for whom giving is not about the giver. One of the highlights of running GiveWell has been coming into contact with the people who share this value with us.
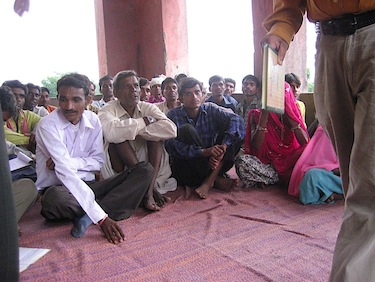 At one orphanage we visited, we were told that the children were sad today because they couldn’t go outside; when we asked why they couldn’t outside, we were told that they were staying in to meet us. On another visit, we joined a village meeting and were told that the people had been waiting for us for over an hour. We were embarrassed and unnerved by these situations.
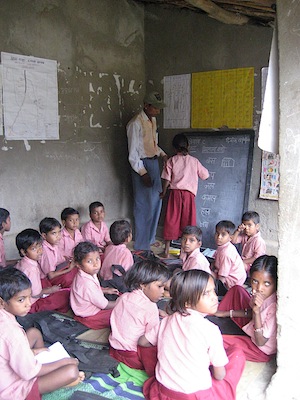 We have mixed feelings about
  I was surprised by the level of interest in the