In addition to evaluations of other charities, GiveWell publishes substantial evaluation on itself, from the quality of its research to its impact on donations. This year we plan to add quarterly updates regarding two key metrics: (a) donations to top charities directly through our website (b) web traffic. This is the first of these updates.
Money moved
By “money moved” we mean donations to our top charities that we can confidently identify as being made on the strength of our recommendation. This update focuses only on “money moved” that comes through GiveWell’s website; we’ll report on all donations due to GiveWell’s research at the end of the year (when the majority of large gifts occur).
While money moved through the website is only a fraction of overall money moved (and is also far greater in December than in other months), we believe this is a meaningful metric for tracking our progress/growth (as opposed to overall influence).
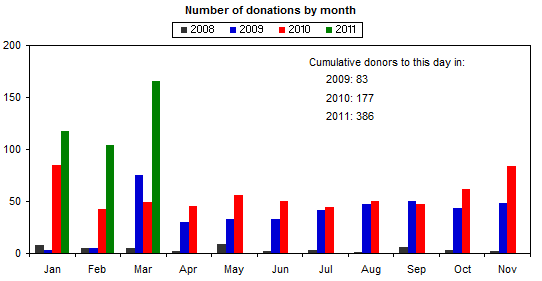
The charts below show dollars donated and the number of donations by month. Thus far, growth in 2011 has been strong.
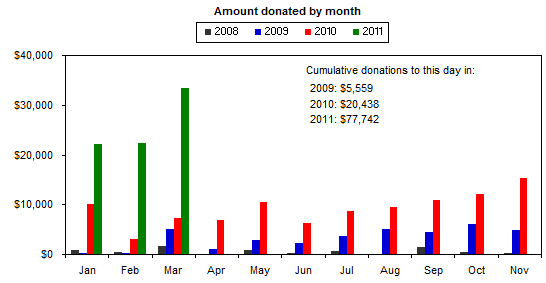
This growth comes almost entirely from new GiveWell donors. We can’t identify the source for the vast majority of additional dollars donated — new donors have arrived at our website either via searching for “GiveWell” online or coming directly (i.e., entering www.givewell.org into their browser). Of the 2010 users who responded to surveys about where they heard about us, 13% found us via search, 23% found us through media, 25% found us through word of mouth or links from other sites, and 38% found us through the outreach of Peter Singer.
Our response to the Japan earthquake and tsunami appears to have led to a significant increase in traffic to the GiveWell website (more below) and a significant increase in the number of donations through our website, though not in the total dollar amount. We estimate that approximately $3,000 was given by 60 donors to Doctors Without Borders through our website as a result of our recommendation (in addition to approximately $1,500 in donations that donors contacted us and told us about).
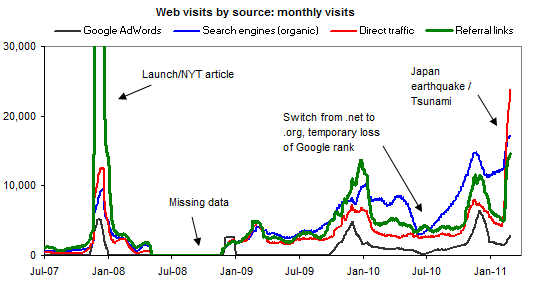
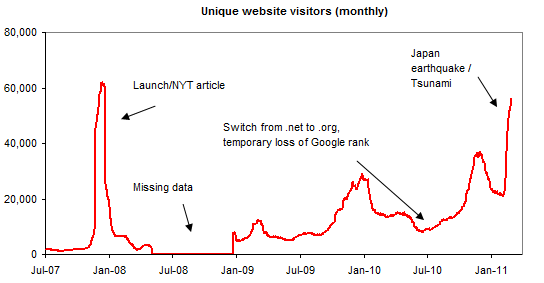
Web traffic
The charts below show our web traffic over time, including the latest quarter. The most significant recent event was our increased traffic in the aftermath of the Japan earthquake and tsunami, for which many appear to have sought and cited our analysis.
Comments
You didn’t include data on the break-up of donations by organization (i.e., which organization received how much). Was that a deliberate omission?
We don’t plan on including this information in quarterly reports because (a) there are some donations that it takes a while to attribute to an organization; (b) overall we don’t feel these figures are very meaningful or good predictors of what the year-end allocation will be.
That said, I’m happy to provide the numbers we do have to you:
60% of donations went to VillageReach; 13% to Pratham, and 12% to AMF. We still don’t know the organization for 9% of donations. These were given in February or March and processed via Network for Good and NFG hasn’t yet sent us the organization breakdown. We estimate that approximately half of this went to Doctors Without Borders (our recommendation following the Japan earthquake) and the other half was split between Stop TB, PSI, and PIH. The Small Enterprise Foundation received 2% of donations.
The remaining 3% was split between NFP, Invest in Kids, KIPP, and VEF.
Comments are closed.