In addition to evaluations of other charities, GiveWell publishes substantial evaluation of itself, from the quality of its research to its impact on donations. We publish quarterly updates regarding two key metrics: (a) donations to top charities and (b) web traffic.
The table and chart below present basic information about our growth in money moved and web traffic in the first quarter of 2014 (note 1).
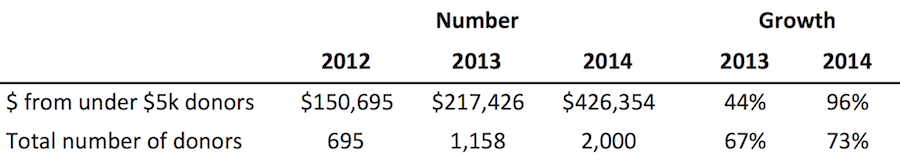
Growth in money moved, as measured by donations from donors giving less than $5,000 per year, was strong in the first quarter of 2014 (money moved was 96% higher than in the first quarter of 2013), and was substantially stronger than growth in the first quarter of 2013. The total amount of money we move is driven by a relatively small number of large donors. These donors tend to give in December, and we don’t think we have accurate ways of predicting future large gifts (note 2). We therefore show growth among small donors, the portion of our money moved about which we think we have meaningful information at this point in the year.
Growth in number of donors was also strong, and similar to growth in this metric in the first quarter of 2013.
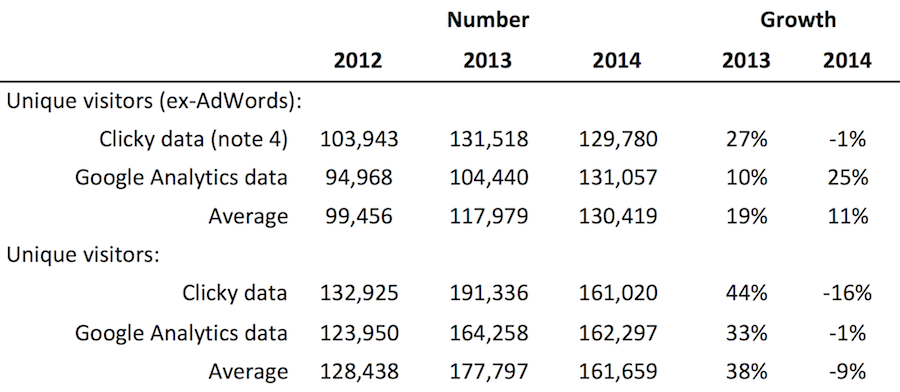
In the past, we have relied on data from the web analytics company Clicky for our metrics updates. We also track web traffic through Google Analytics, and between January 2012 and February 2014, Google Analytics consistently tracked lower overall traffic than Clicky. We do not know what the cause of the discrepancy between the two sources is, and do not have a view on which data source is more likely to be correct. For that reason, we present data from both sources here. Full data set available at this spreadsheet. (Note on how we count unique visitors.)
Traffic from AdWords decreased in the first quarter because in early 2014 we removed ads on searches that we determined were not driving high quality traffic to our site (i.e. searches with very high bounce rates and very low pages per visit).
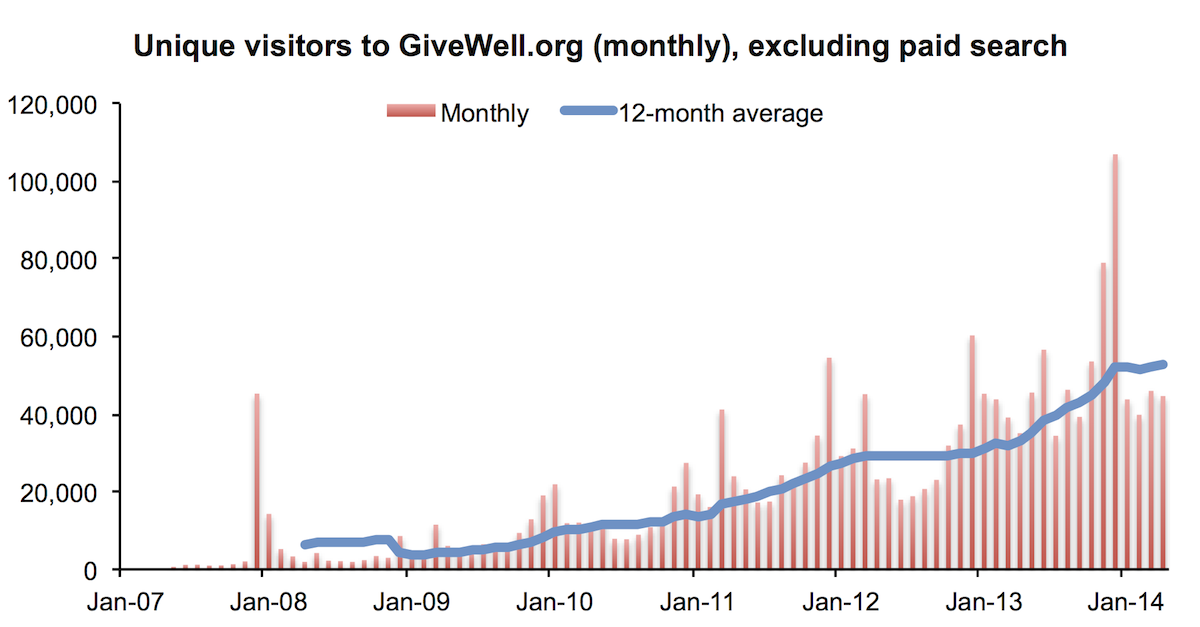
Data in the chart below is an average of Clicky and Google Analytics data, except for those months for which we only have data (or reliable data) from one source (see full data spreadsheet for details).
Note 1: Since our 2012 annual metrics report we have shifted to a reporting year that starts on February 1, rather than January 1, in order to better capture year-on-year growth in the peak giving months of December and January. Therefore metrics for the “first quarter” reported here are for February through April.
Note 2: In total, GiveWell donors have directed $1.45 million to our top charities this year, compared with $0.70 million at this point in 2013. For the reason described above, we don’t find this number to be particularly meaningful at this time of year.
Note 3: We count unique visitors over a period as the sum of monthly unique visitors. In other words, if the same person visits the site multiple times in a calendar month, they are counted once. If they visit in multiple months, they are counted once per month.
Note 4: Google Analytics provides ‘unique visitors by traffic source’ while Clicky provides only ‘visitors by traffic source.’ For that reason, we primarily use Google Analytics data in the calculations of ‘unique visitors ex-AdWords’ for both the Clicky and Google Analytics rows of the table. See the full data spreadsheet, sheets Data and Summary, for details.
Comments
I work as a web developer and would be happy to look into the Clicky/Analytics issue if you’d like – my email address should be attached to this form.
I’m confused about how you interpret/use your metrics for small vs large donors.
You say you focus on small donors because “[large] donors tend to give in December, and we don’t think we have accurate ways of predicting future large gifts.” Are you implying that this isn’t true of small donors or am I completely missing your rationale for emphasizing small donors?
I would have thought small donors are also tended to give at end of year and that this also makes it difficult to predict future small gifts. Do you, for example, see that growth in small donors is fairly consistent across the year, e.g. that the Q1 ~100% growth in small donors would lead you to predict similar growth in Q4? Or have some other use of the data?
As you say, “total amount of money we move is driven by a relatively small number of large donors,” so I’d think that makes large donors particularly interesting to understand. And it seems like you’re reporting strong growth there as well… If I am reading your note correctly, there’s ~120% growth in large donors’ donations: $1.1m ($1.5m total – $.4 small) vs $.5m ($7. total – $.2 small). Is that right?
Do you have any other information that you can easily share on this growth (e.g. at a minimum, it would be interesting to know if this is all just Good Ventures, or if it excludes GV)?
Kevin – Thanks! I’ve emailed you.
Tyler –
The reason we focus on donations from small donors in the first three quarters of the year is that there are more data points for small donations and so the data is more meaningful. The total from larger donors can be skewed by just a few donors (e.g. a donor who decides to give in March one year and June the next) and so in aggregate it doesn’t provide much information. Both groups tend to give in December, but a smaller proportion do give in other months, and we’ve found that tracking growth earlier in the year gives some indication of overall annual growth. We use this data more as an indication that things are moving in the right direction than as a projection of what annual growth will be.
The total money moved figure given in note 2 excludes Good Ventures. Growth from larger donors, excluding Good Ventures, was also strong in Q1 2014. Though, as we’ve said, we don’t put a lot of stock in this figure because it was driven by a small number of gifts.
Comments are closed.