This is the final post (of six) we have made focused on our self-evaluation and future plans.
This post lays out highlights from our metrics report for 2014. For more detail, see our full metrics report (PDF). Note, we report on “metrics years” that run from February – January; for example, our 2014 data cover February 1, 2014 through January 31, 2015.
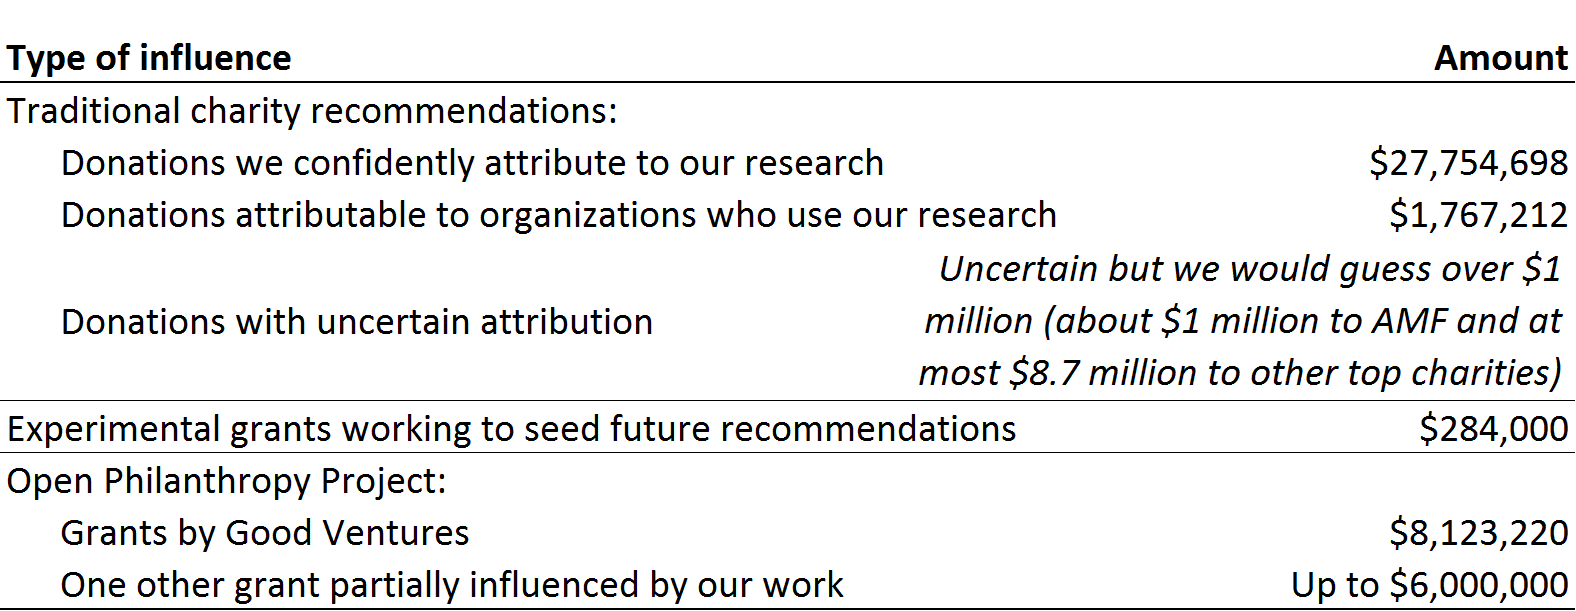
- In 2014, GiveWell influenced charitable giving in several ways. The following table summarizes the money that were able to track.
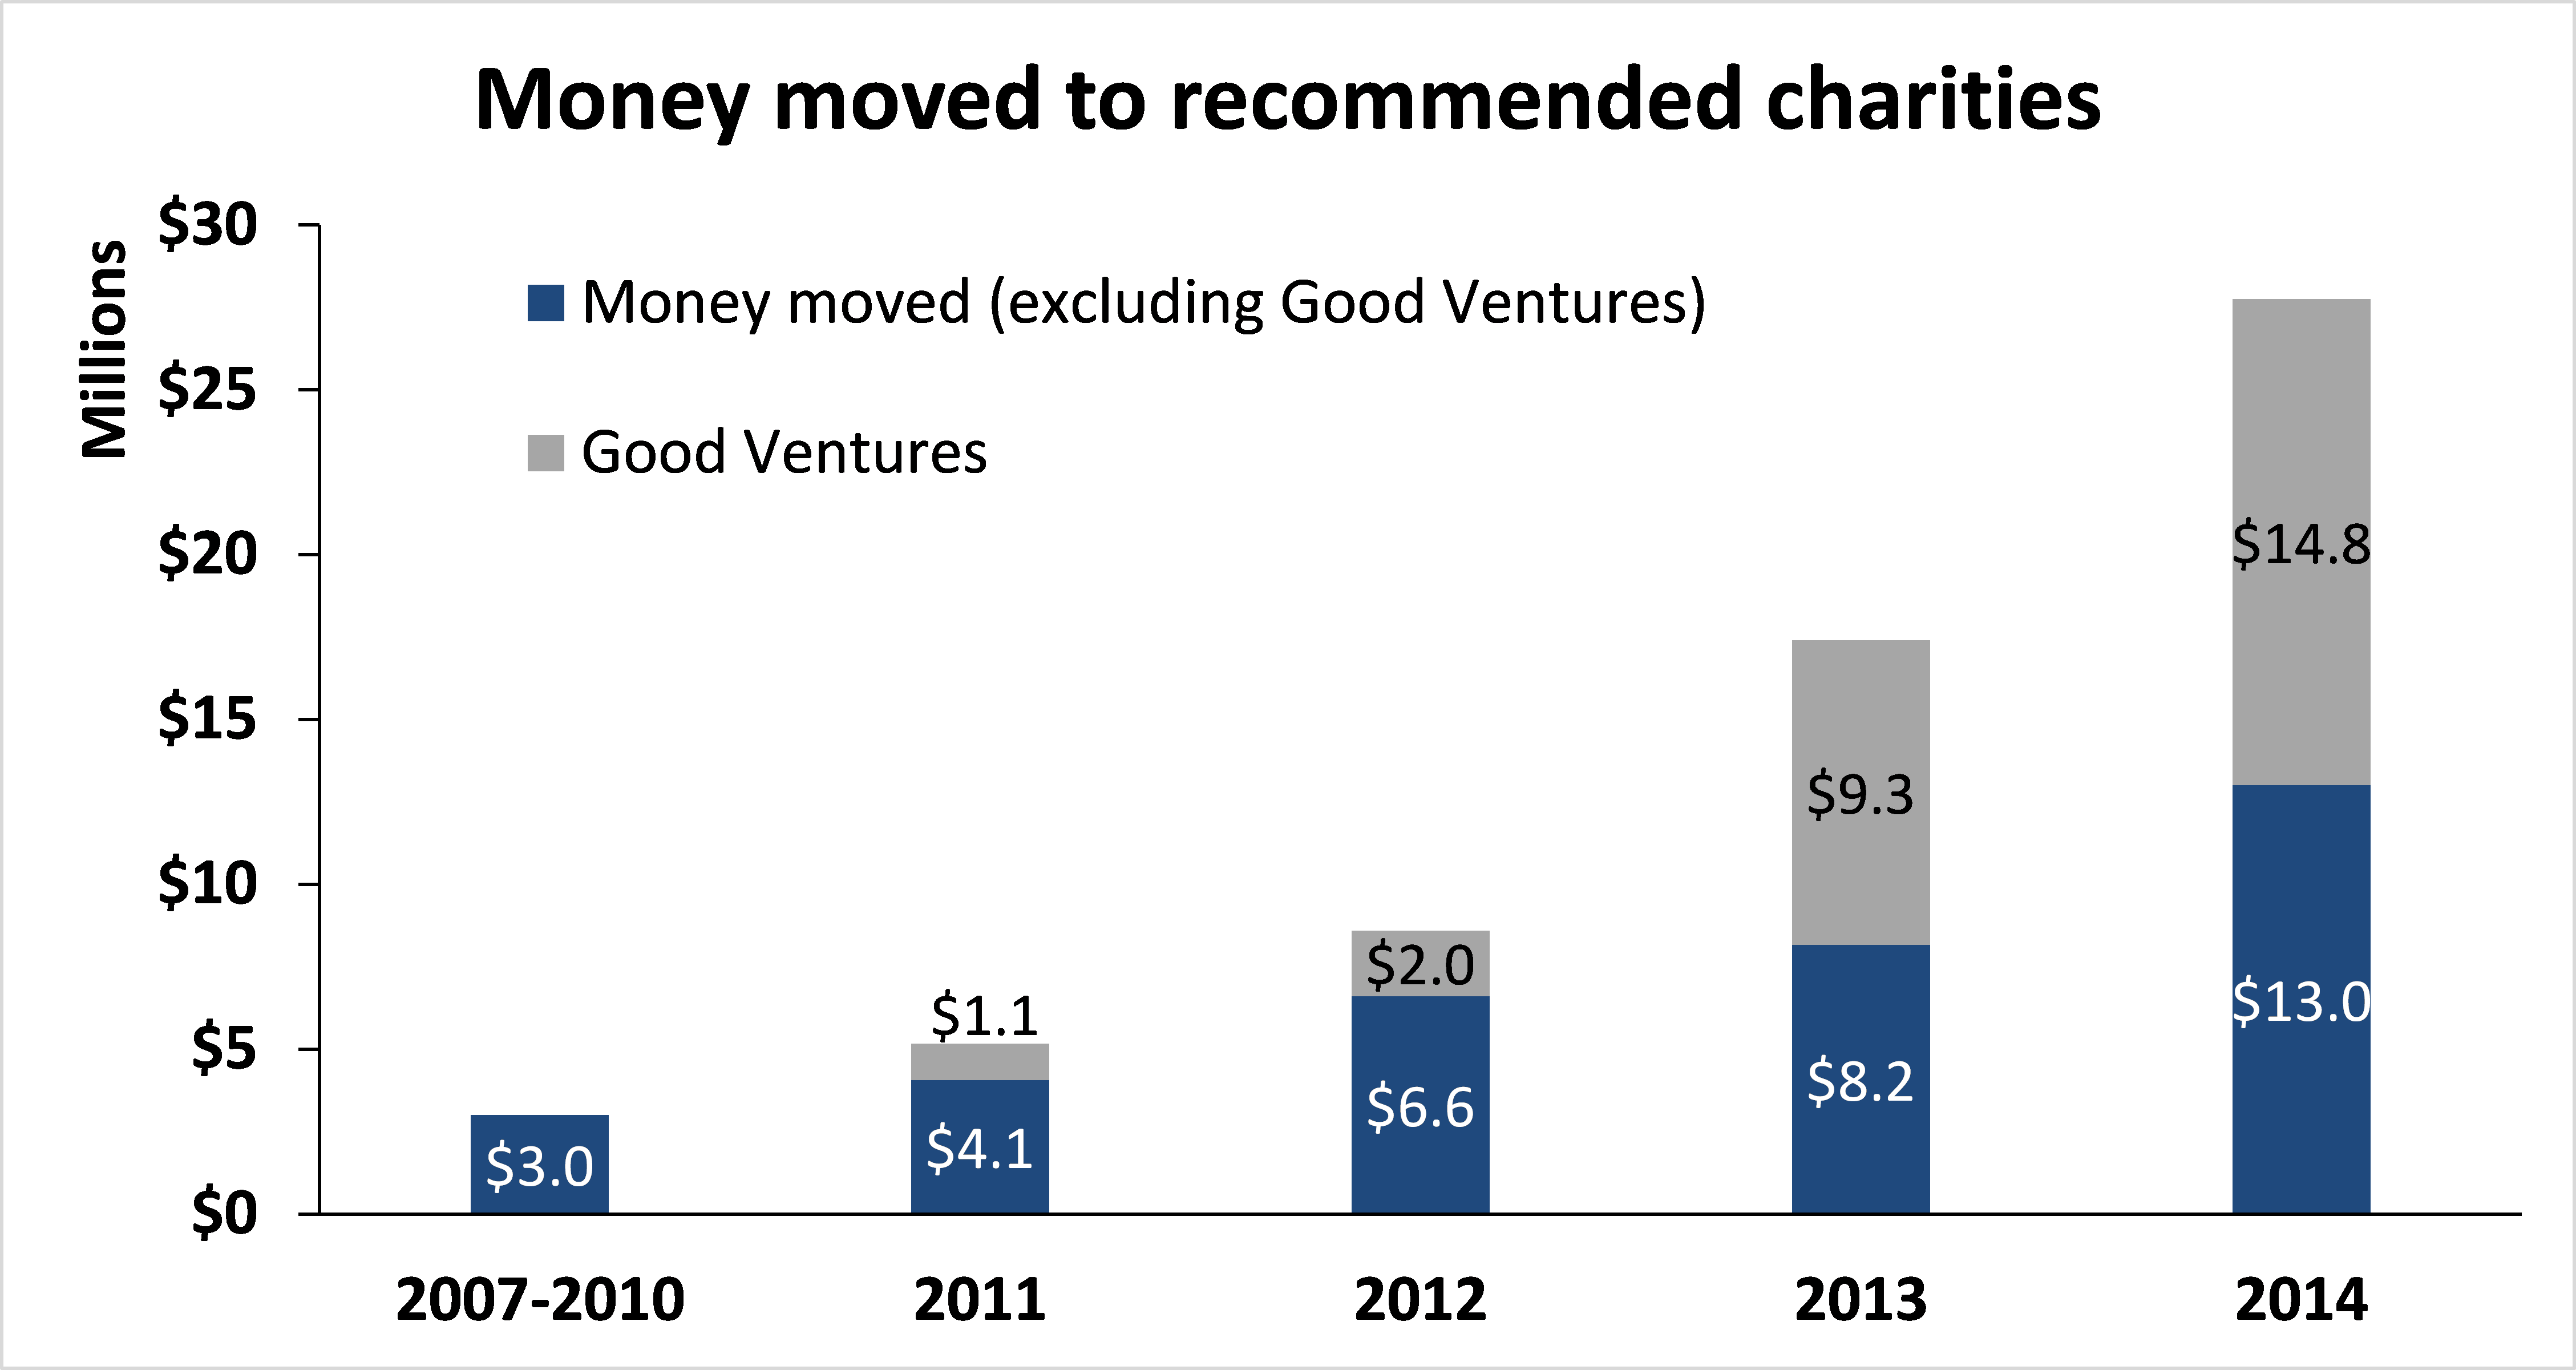
- In 2014, GiveWell tracked $27.8 million in money moved to our recommended charities, about 60% more than in 2013. This total includes $14.8 million from Good Ventures (up from $9.3 million) and $13.0 million from other donors (up from $8.2 million).
- As part of our work on the Open Philanthropy Project, we advised Good Ventures to make grants totaling $8.1 million (this was in addition to Good Ventures’ support for our top charities and standout charities). In addition, the Laura and John Arnold Foundation provided a commitment of up to $6 million to the Meta-Research Innovation Center at Stanford after we connected these organizations.
- Our total expenses were $1.8 million in 2014. We estimate that about half supported our traditional top charity work and about half supported the Open Philanthropy Project. Our expenses increased from about $960,000 in 2013 and about $560,000 in 2012 as the size of our staff grew.
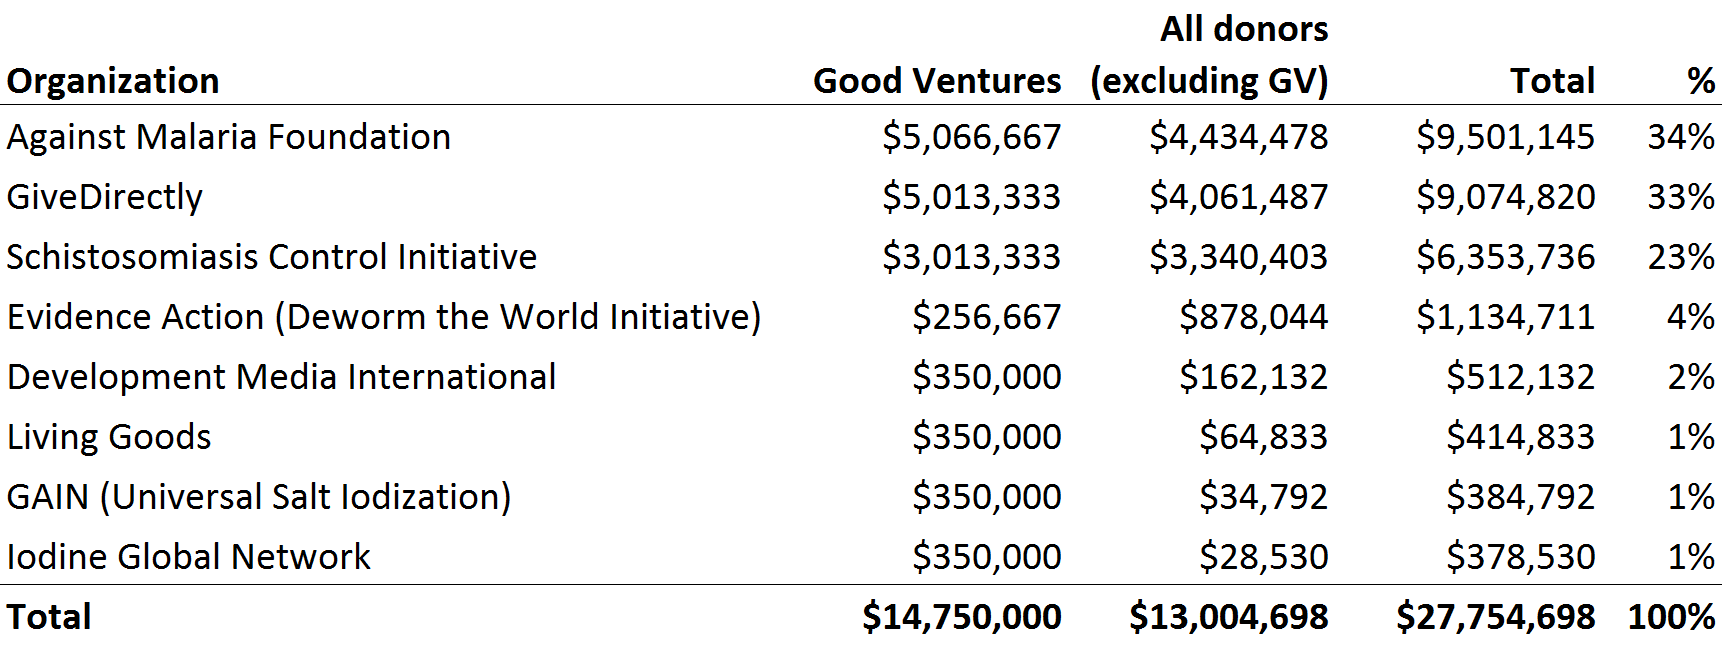
- Our four top charities received the majority of the $28.1 million tracked to our recommended charities. Our four standout charities received about $1.7m total (mostly from Good Ventures).
- In 2014, the number of donors and amount donated increased across each donor size category. Last year, we discussed a substantial decrease among the largest donors from 2012, which we expected might be somewhat temporary. While that category rebounded strongly, it was driven by donors who gave $50,000 or more to our recommended charities for the first time.

- In 2014, the total number of donors giving to our recommended charities or to GiveWell unrestricted did not grow significantly (up 9% to about 9,300). This is largely due to many new donors in 2013 (particularly donors who gave less than $1,000) not giving again in 2014.

Our retention was stronger among donors who gave larger amounts or who first gave to our recommendations prior to 2013. Of larger donors (those who gave $10,000 or more in either of the last two years), about 80% who gave in 2013 gave again in 2014.
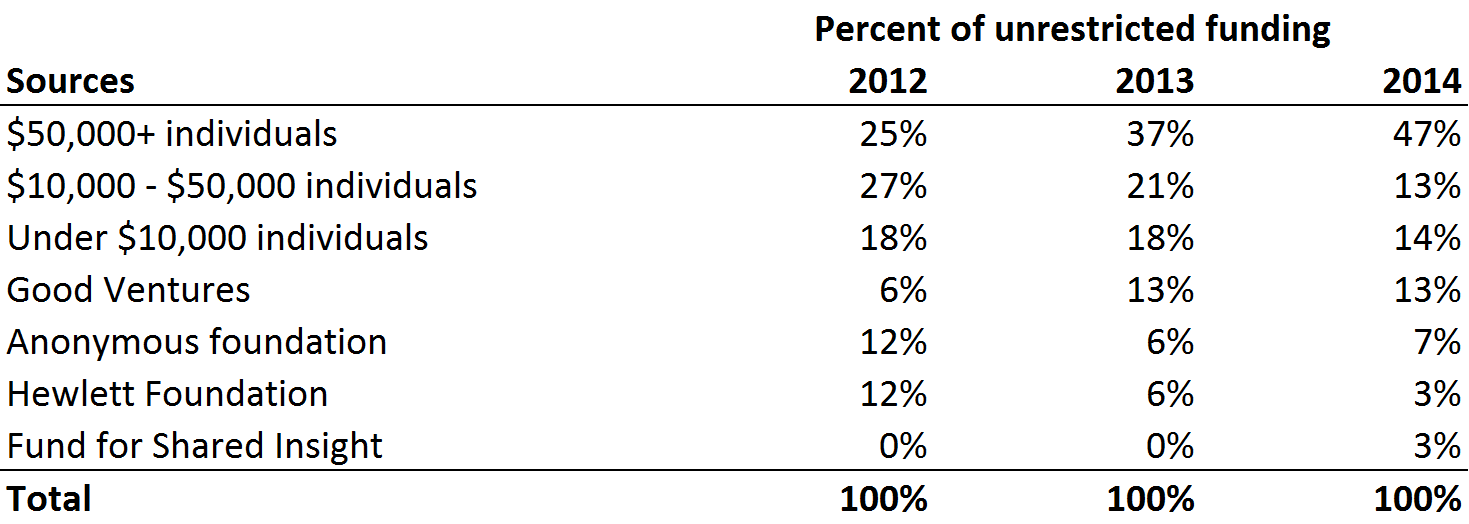
- Prior to 2013, GiveWell relied on a small number of donors to provide unrestricted support for our operations. Over the last two years, we’ve asked donors for more operational support. In 2014, we raised $3.0 million, up from $1.8 million in 2013 and $0.8 million in 2012. Four institutions and the nine largest individual donors contributed about 75% of GiveWell’s funding in 2014.
- We continued to collect information on our donors. We found the picture of our 2014 donors to be broadly consistent with previous information. Based on reports from donors who gave $2,000 or more, we found:
- The most common ways donors found us was via Peter Singer and personal referrals.
- Many of the donors are under 40 and work in technology and finance.
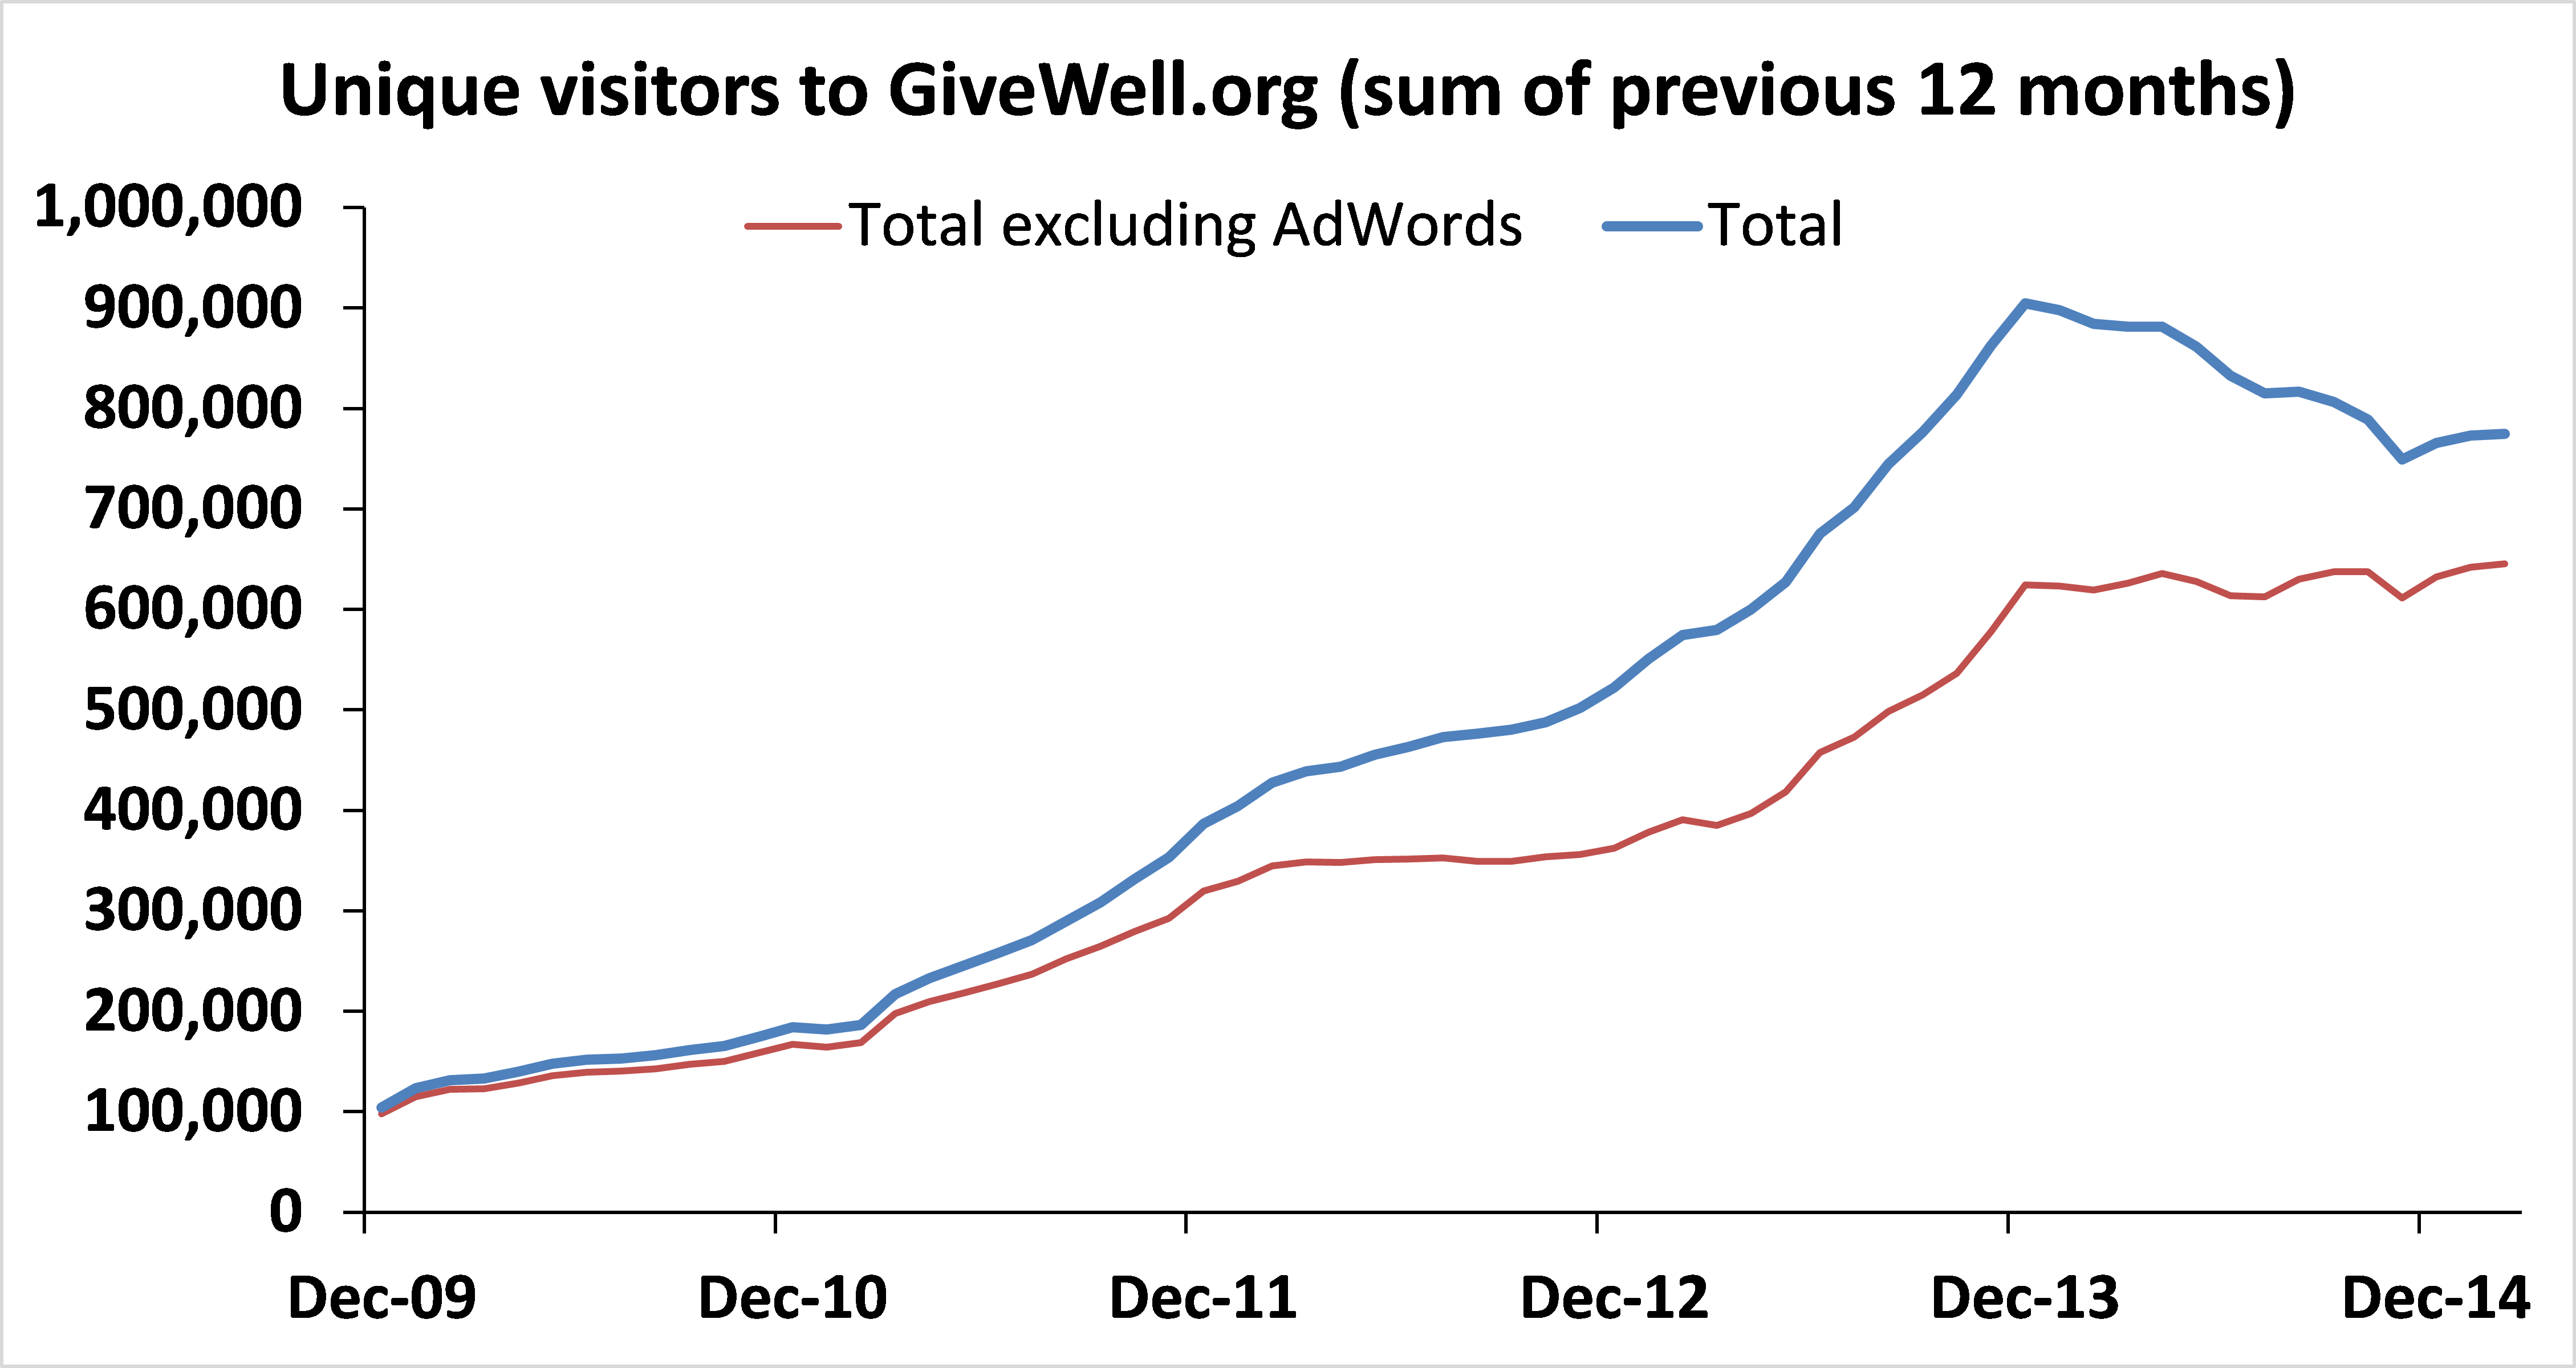
- Excluding AdWords, unique visitors to our website increased by 9% in 2014 compared to 2013. Including AdWords, unique visitors decreased by 11%. In late 2013, we removed some AdWords campaigns that were driving substantial traffic but appeared to be largely resulting in visitors who were not finding what they were looking for (as evidenced by short visit duration and high bounce rates). Traffic directly to our website increased, but traffic from other non-paid sources was basically unchanged.

- In the past, we compared GiveWell’s online money moved to that of Charity Navigator and GuideStar. This year, we did not find data from Charity Navigator and GuideStar so do not have an updated comparison.
For more detail, see our full metrics report (PDF).

Comments
It’s great to see donation growth pick up substantially over this period. I hope that the series of effective altruism related books this year will rebuild the momentum from Peter Singer’s TED talk.
“In addition, the Laura and John Arnold Foundation provided a commitment of up to $6 million to the Meta-Research Innovation Center at Stanford after we connected these organizations.”
I’m looking forward to seeing OPP have influence in its other portfolio areas as they develop.
“This year, we did not find data from Charity Navigator and GuideStar so do not have an updated comparison.”
I wonder if it’s a coincidence that Charity Navigator stopped reporting this data immediately after GiveWell surpassed it in money moved through website last year. Since Navigator money moved had been holding steady around $3 million for four years, this would probably put GiveWell ahead by about a half unless there was a sudden shift in trend.
https://www.givewell.org/files/images/website%20money%20moved%20by%20evaluators%202013.png
Would be nice to include some ROI analysis – whats the impact of each dollar spent by givewell (in terms of incremental dollars invested from your work and ultimate result by the recomended charities)
Al,
We don’t generally focus on this type of metric because we think the uncertainty is extremely high. For example:
1. We don’t have a quantitative estimate of the counterfactual impact, i.e. giving that would have happened without GiveWell’s recommendation.
2. We think there is extreme uncertainty and difficult judgments in applying our cost-effectiveness estimates (for example, see https://blog.givewell.org/2011/08/18/why-we-cant-take-expected-value-estimates-literally-even-when-theyre-unbiased/).
3. We expect much of the impact from GiveWell’s current expenses will come in the future (i.e. we are investing in capacity building).
With that said, a rough estimate representing how we could begin to think about the “return” from our expenses:
1. ~$0.9m in expenses on our traditional charity work led to money moved that we’d estimate to deliver ~1.5m bednets, ~$7.9m in cash transferred, and ~5.2m deworming treatments.
2. We estimate these could have an impact equivalent to saving a total of ~6000 lives.
3. Adjusting these based on an estimate for the counterfactual could lead you to an estimate of GiveWell’s impact per dollar.
(These calculations and sources are laid out here: http://files.givewell.org/files/Impact_per_dollar.xlsx)
Comments are closed.