In addition to evaluations of other charities, GiveWell publishes substantial evaluation on itself, from the quality of its research to its impact on donations. This year, we have added quarterly updates regarding two key metrics: (a) donations to top charities directly through our website (b) web traffic.
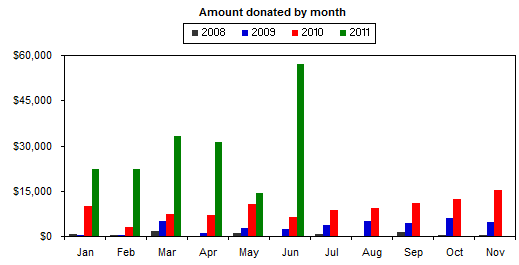
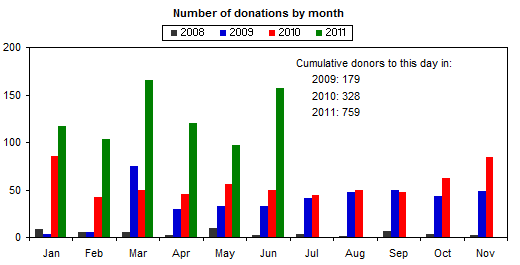
Money moved
By “money moved” we mean donations to our top charities that we can confidently identify as being made on the strength of our recommendation. This update focuses only on “money moved” that comes through GiveWell’s website; we’ll report on all donations due to GiveWell’s research at the end of the year (when the majority of large gifts occur).
While money moved through the website is only a fraction of overall money moved (and is also far greater in December than in other months), we believe this is a meaningful metric for tracking our progress/growth (as opposed to overall influence).
The charts below show dollars donated and the number of donations by month. While there’s evidence of noise — May was an unusually slow month, June an unusually strong one — overall, growth in 2011 has been strong.
We report annually money moved to each of our recommended charities, but we don’t plan on including this information in quarterly reports because (a) there are some donations that have been made but we can’t yet to attribute to an organization; (b) overall we don’t feel these figures are very meaningful or good predictors of what the year-end allocation will be.
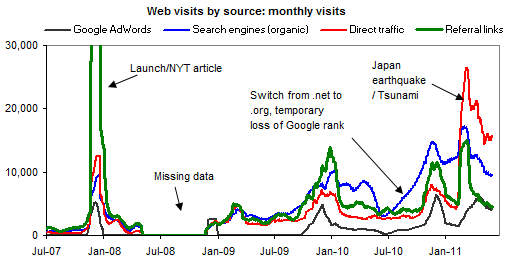
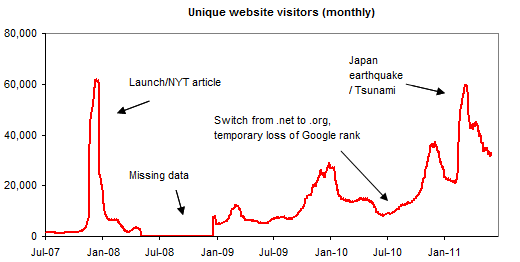
Web traffic
The table below shows quarterly web traffic to GiveWell’s website.
| Quarter | Visitors | Y/Y growth |
|---|---|---|
| Q1 2009 | 20,681 | – |
| Q2 2009 | 14,974 | – |
| Q3 2009 | 18,418 | – |
| Q4 2009 | 45,956 | – |
| Q1 2010 | 48,027 | 132% |
| Q2 2010 | 33,173 | 122% |
| Q3 2010 | 27,729 | 51% |
| Q4 2010 | 68,870 | 50% |
| Q1 2011 | 89,588 | 87% |
| Q2 2011 | 102,506 | 209% |
The charts below show our web traffic over time, including the latest quarter.