In addition to evaluations of other charities, GiveWell publishes substantial evaluation of itself, from the quality of its research to its impact on donations. We publish quarterly updates regarding two key metrics: (a) donations to recommended charities and (b) web traffic. This post is being published late due to staff focusing on updating GiveWell’s charity recommendations in the fourth quarter; it also includes a preliminary view of our money moved since the end of our third quarter.
Preliminary estimate of 2015 money moved (since February 1, 2015)
As of early January 2016, we have tracked about $98 million in money moved to our recommended charities. Excluding Good Ventures, we have tracked about $28 million (of which, roughly half has come from donors giving $1 million or more).
These data are preliminary. We expect that in some cases we are currently overstating our impact (e.g. due to double counting or incorrect attribution of our influence) and in other cases we are understating our impact (since there are several weeks left in our metrics year and there are delays entering data); overall, we would guess that we are currently underestimating our annual money moved. We plan to publish our annual metrics (covering February 1, 2015 – January 31, 2016) in March, at which point we will have more confidence in our data and be able to share more details.
GiveWell’s web traffic / money moved through Q3 2015
The tables and chart below present basic information about our growth in money moved and web traffic in the first three quarters of 2015 compared to the previous two years (note 1).
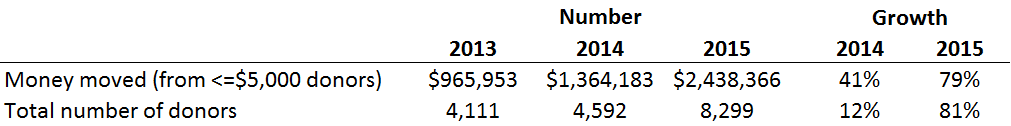
Money moved by donors who have never given more than $5,000 in a year increased about 80% to $2.44 million. The total number of donors in the first three quarters increased about 80% to about 8,300 (note 2). These growth rates are reasonably consistent with the growth we previously reported in our first and second quarter metrics.
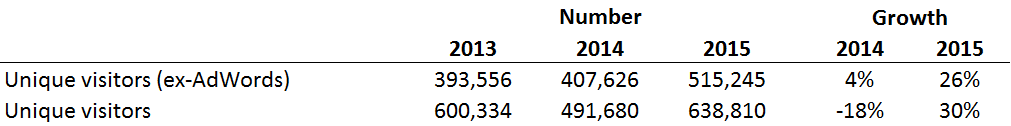
Growth in web traffic excluding Google AdWords increased about 25% in the first three quarters. Last year, we saw a drop in total web traffic because we removed ads on searches that we determined were not driving high quality traffic to our site (i.e. searches with very high bounce rates and very low pages per visit).
GiveWell’s website receives elevated web traffic during “giving season” around December of each year. To adjust for this and emphasize the trend, the chart below shows the rolling sum of unique visitors over the previous twelve months, starting in December 2009 (the first period for which we have 12 months of reliable data due to an issue tracking visits in 2008).
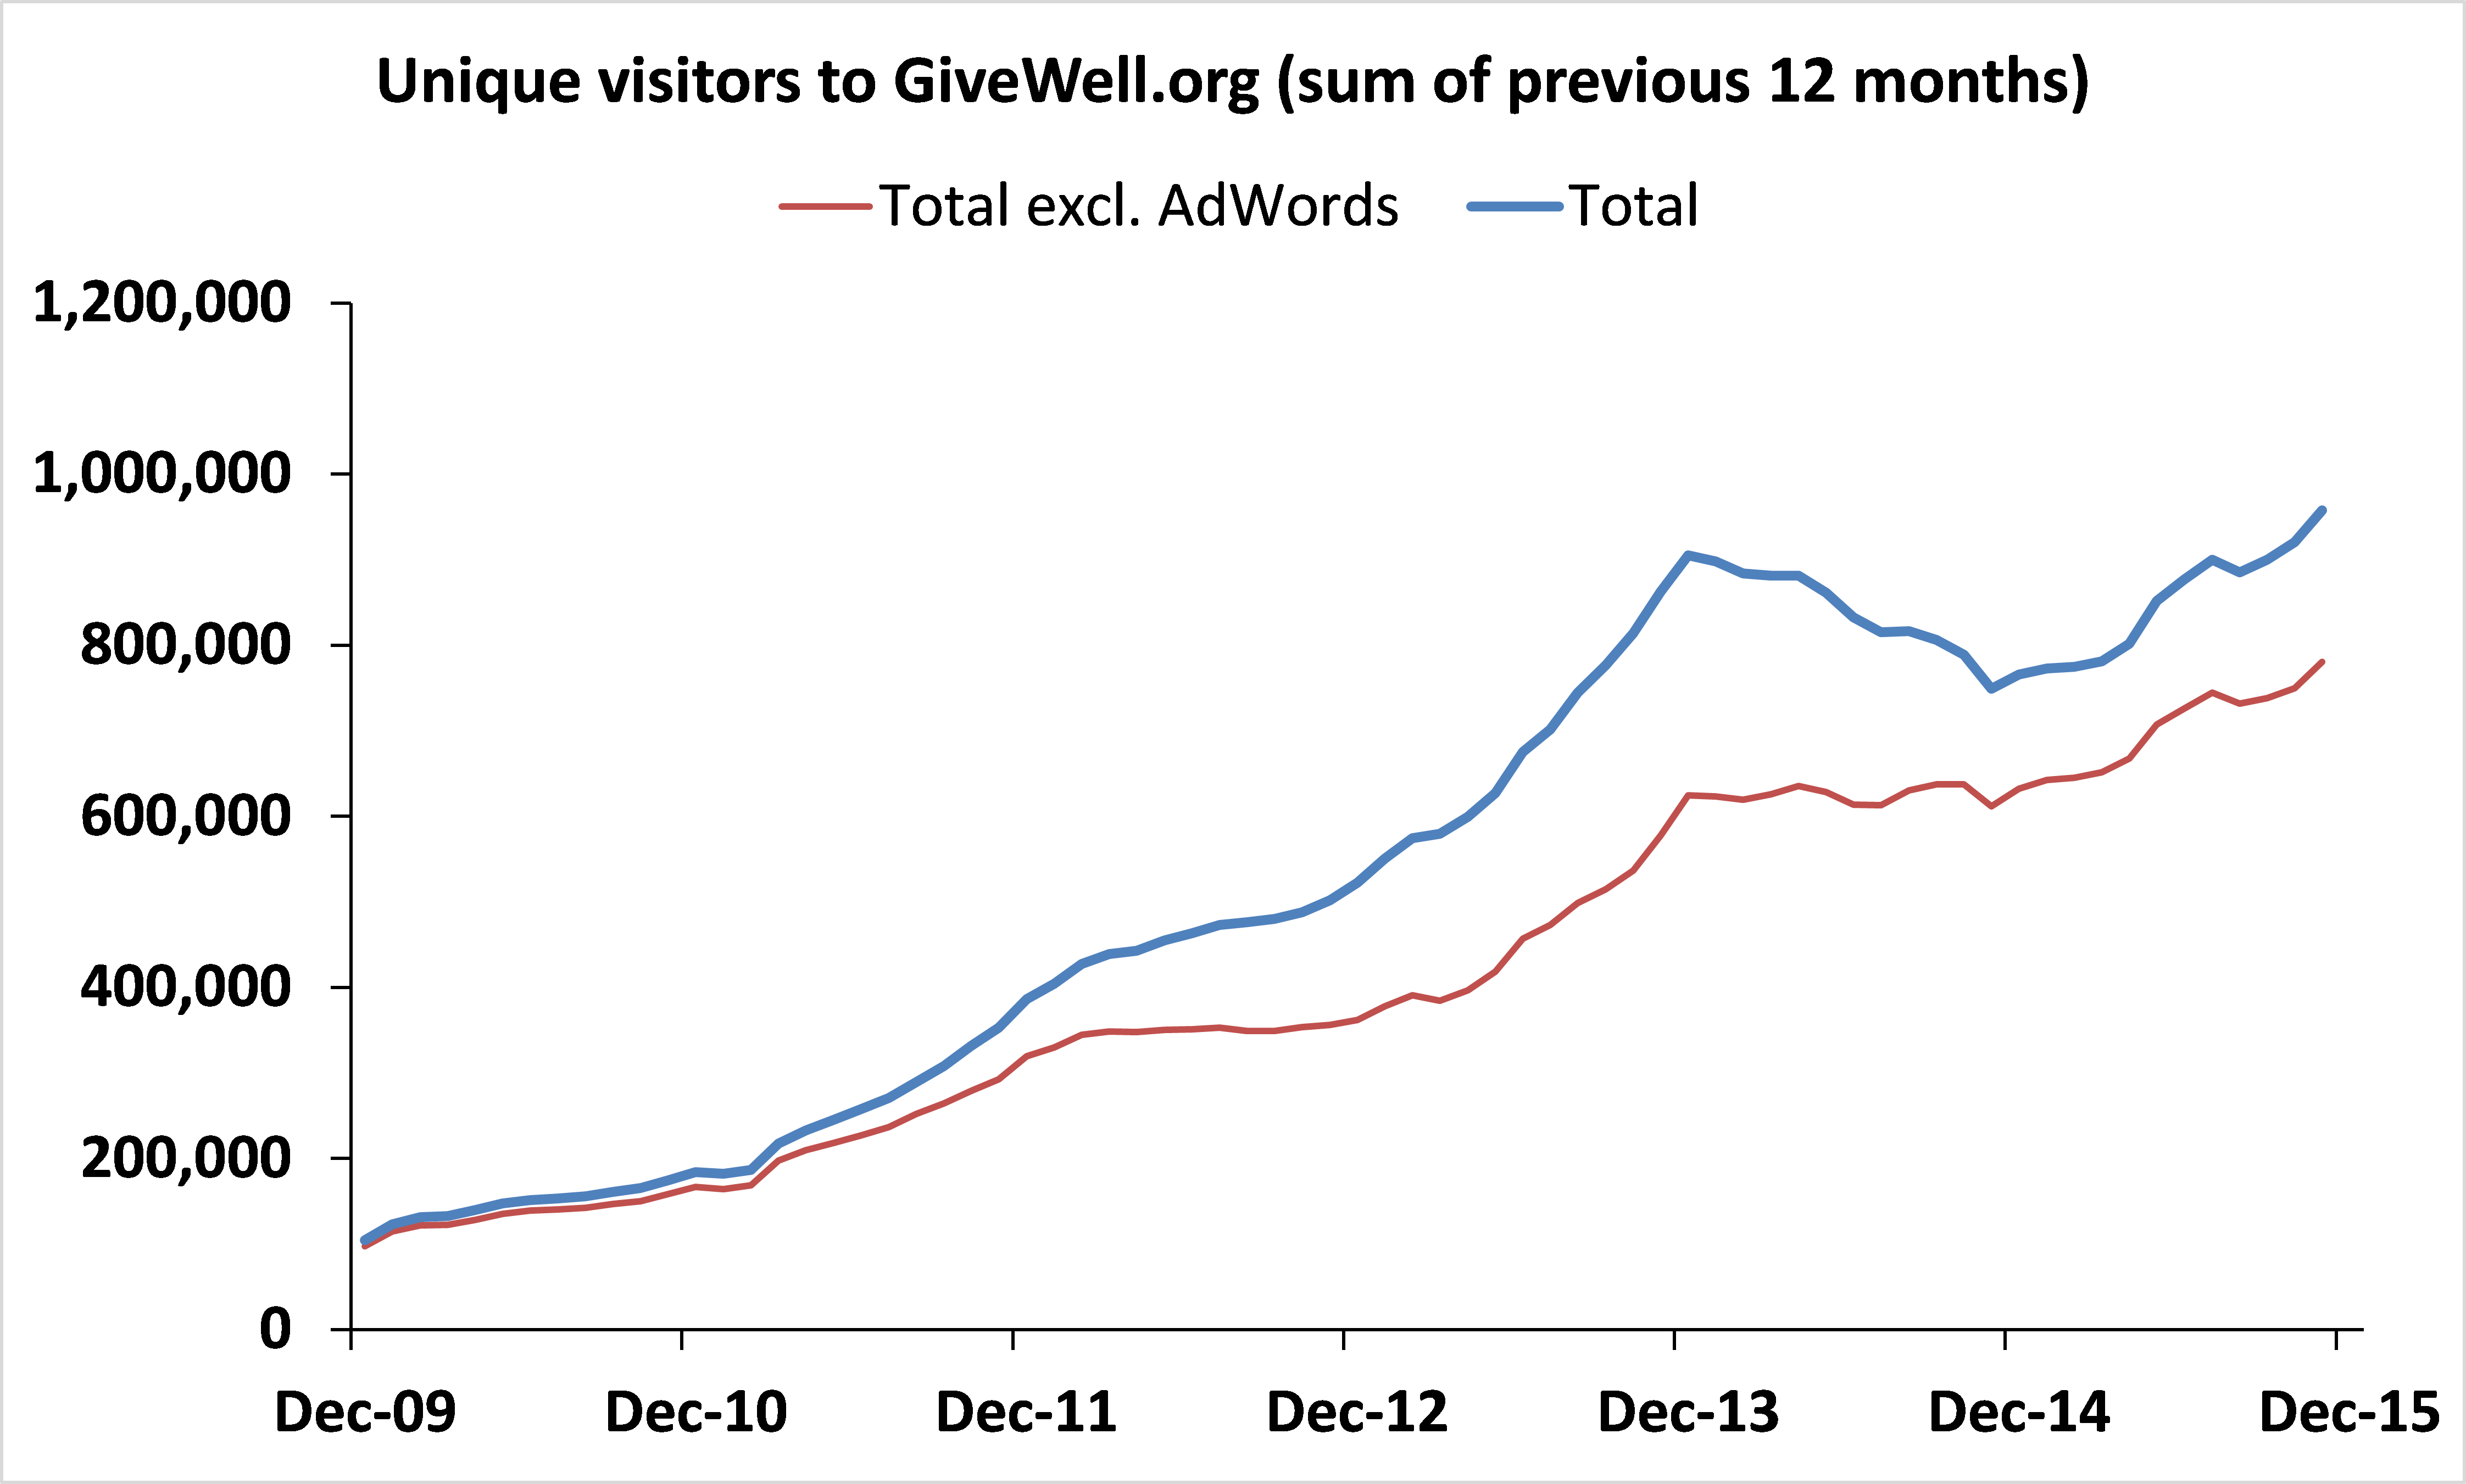
We use web analytics data from two sources: Clicky and Google Analytics (except for those months for which we only have reliable data from one source). The raw data we used to generate the chart and table above (as well as notes on the issues we’ve had and adjustments we’ve made) is in this spreadsheet (note 3, on how we count unique visitors).
Note 1: Since our 2012 annual metrics report we have shifted to a reporting year that starts on February 1, rather than January 1, in order to better capture year-on-year growth in the peak giving months of December and January. Therefore, metrics for the “first three quarters” reported here are for February through October.
Note 2: Our measure of the total number of donors may overestimate the true number. We identify individual donors based on the reported name and email. Donors may not share all of this information or may update it (for example, using a different email), in which case, we may mistakenly treat a donation as if it was made by a new donor. We plan to investigate how large of an overstatement there may be and possibly adjust the total for our next annual metrics report.
Note 3: We count unique visitors over a period as the sum of monthly unique visitors. In other words, if the same person visits the site multiple times in a calendar month, they are counted once. If they visit in multiple months, they are counted once per month.