GiveWell is dedicated to finding outstanding giving opportunities and publishing the full details of our analysis. In addition to evaluations of other charities, GiveWell publishes substantial evaluation of our own work. This post lays out highlights from our 2015 metrics report, which reviews what we know about how our research impacted donors. Please note:
- We report on “metrics years” that run from February through January; for example, our 2015 data cover February 1, 2015 through January 31, 2016.
- We differentiate between our traditional charity recommendations, our work on the Open Philanthropy Project, and other charitable giving.
- More context on the relationship between Good Ventures and GiveWell can be found here.
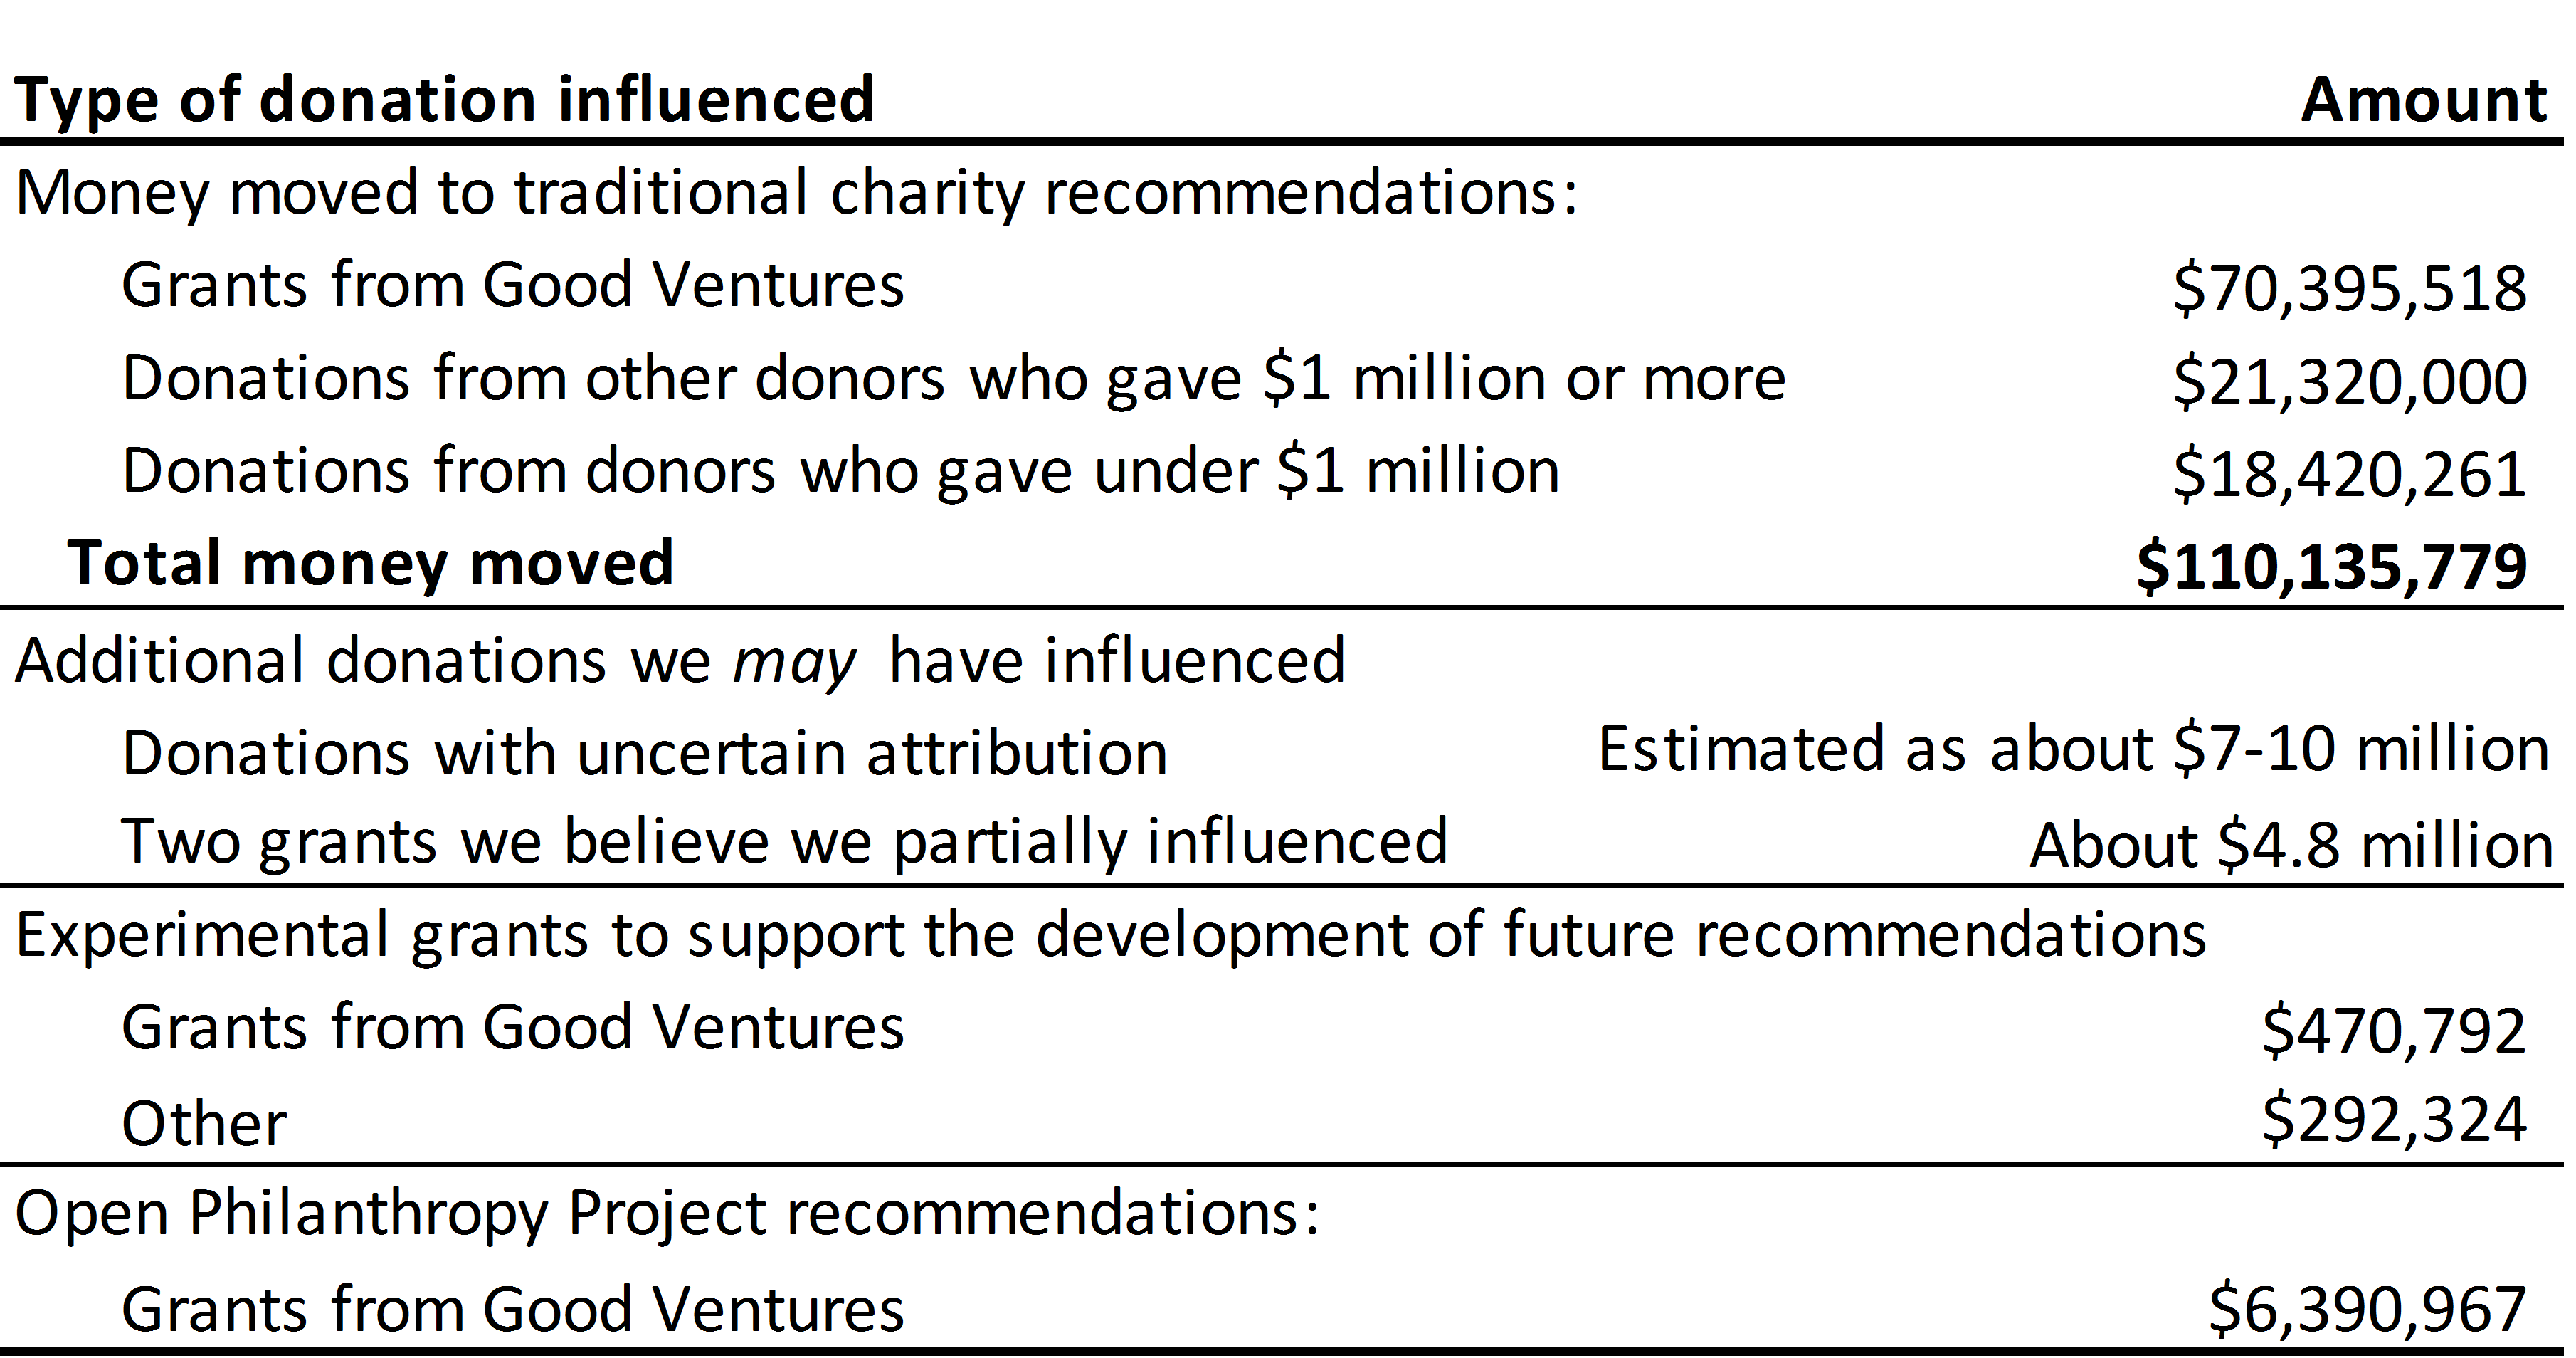
Summary of influence: In 2015, GiveWell influenced charitable giving in several ways. The following table summarizes our understanding of this influence.

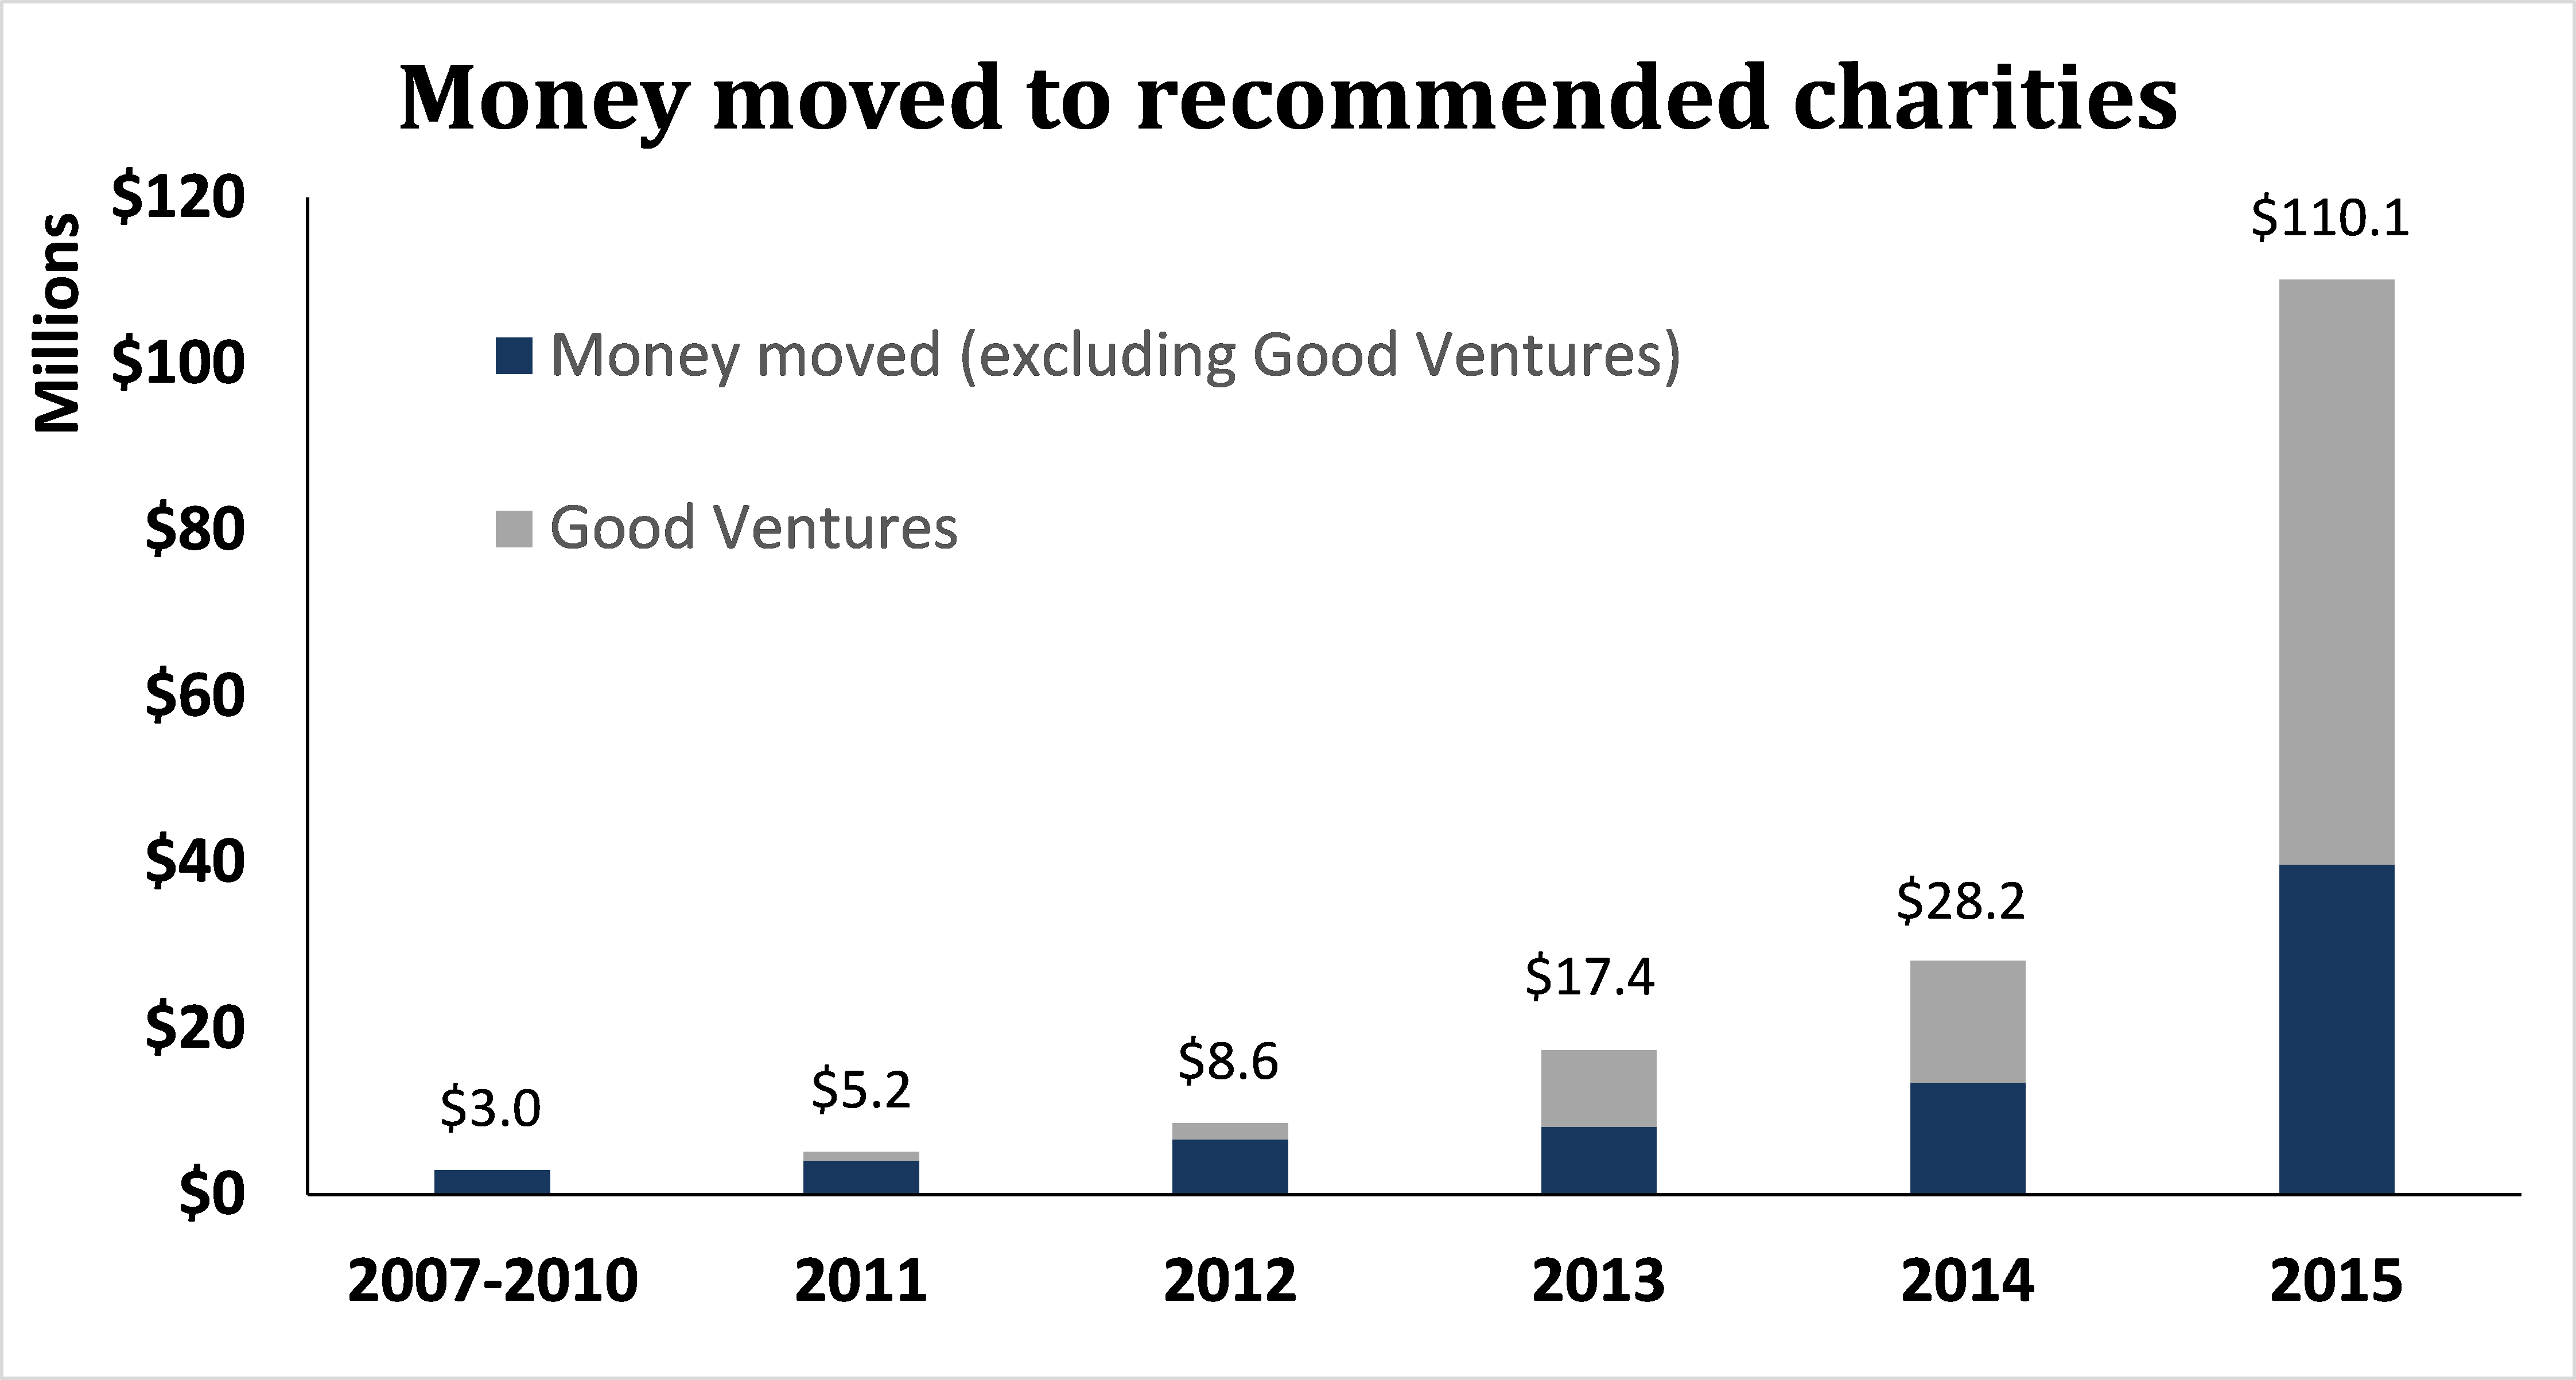
Total money moved: In 2015, GiveWell tracked $110.1 million in money moved to our recommended charities. Our money moved only includes donations that we are confident were influenced by our recommendations.

Open Philanthropy Project: As part of our work on the Open Philanthropy Project, we advised Good Ventures to make grants totaling $6.4 million. This was in addition to Good Ventures’ support for our recommended charities.
Money moved by charity: Our four top charities received the majority of our money moved. Our four standout charities received a total of $2.2 million.

Money moved by size of donor: In 2015, the number of donors and amount donated increased across each donor size category. In 2015, 95% of our money moved (excluding Good Ventures) came from about 15% of our donors, each of whom gave $1,000 or more.

Donor retention: The total number of donors who gave to our recommended charities or to GiveWell unrestricted increased about 60% year-over-year to 15,274 in 2015. This included 10,669 donors who gave to our recommended charities for the first time. Among all donors who gave in the previous year, about 40% gave again in 2015, up from about 33% who gave again in 2014.

Our retention was stronger among donors who gave larger amounts or who first gave to our recommendations prior to 2013. Of larger donors (those who gave $10,000 or more in either of the last two years), about 80% who gave in 2014 gave again in 2015.

GiveWell’s expenses: GiveWell’s total operating expenses in 2015 were $3.4 million. Our expenses increased from about $1.8 million in 2014 as the size of our staff grew, largely to support the Open Philanthropy Project. We estimate that about one-third of our total expenses ($1.1 million) supported our traditional top charity work and about two-thirds supported the Open Philanthropy Project. In 2014, we estimated that expenses for our traditional charity work were about $900,000.
Donations supporting GiveWell’s operations: Prior to 2013, GiveWell relied on a small number of donors to provide unrestricted support for our operations. Since 2013, we have asked more donors to support our operational costs and asked donors to support us at a higher level than we had in previous years. In 2015, we raised $4.9 million, up from $3.0 million in 2014. Several institutions and the six largest individual donors contributed about two-thirds of GiveWell’s funding in 2015.

Donor demographics: We continued to collect information on our donors. We found the picture of our 2015 donors to be broadly consistent with previous information. Based on reports from donors who gave $2,000 or more, we found:
- The most common ways that donors found us were via Peter Singer and personal referrals.
- About 70% of our donors are under 40, and about 60% work in technology or finance.
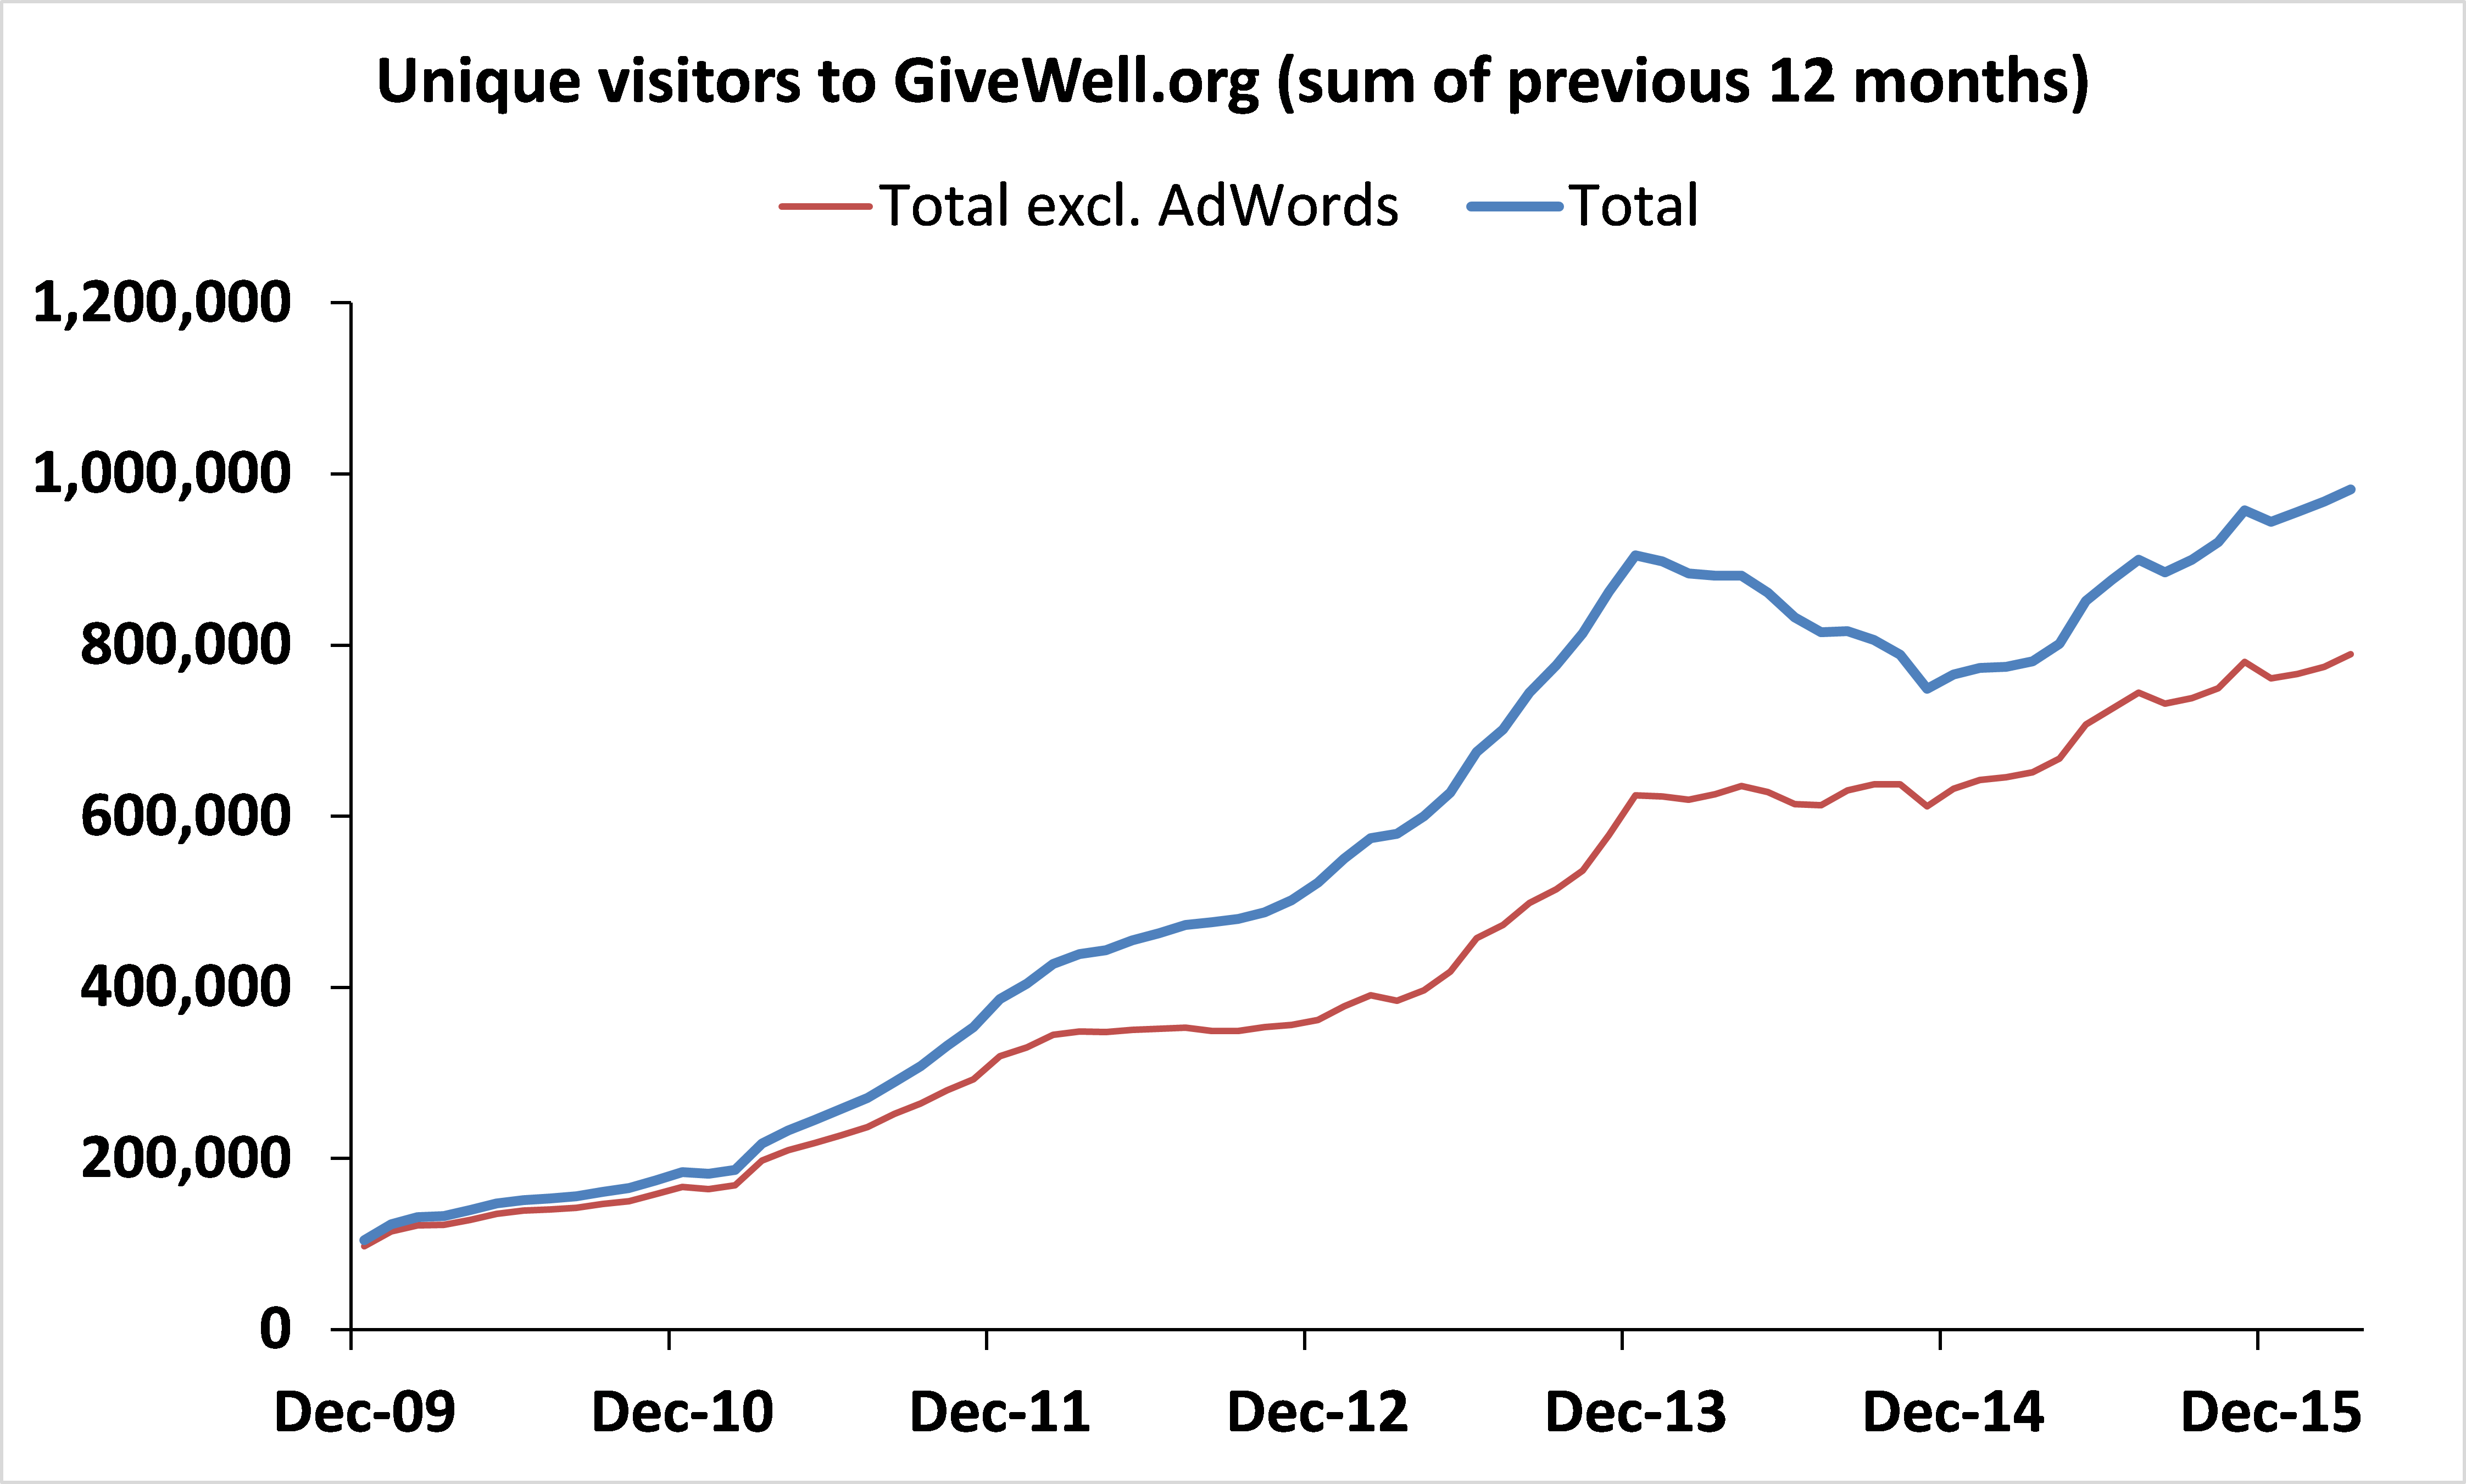
Web traffic: Unique visitors to our website increased by 12% in 2015 compared to 2014 (when excluding visitors driven by AdWords, Google’s online advertising product).

For more detail, see our full metrics report (PDF).

Comments
Congrats! That’s amazing growth!
Yeah, I’m incredibly impressed! Looks like non-GV donations are up nearly 200% over last year (though since this could be driven by a few outliers, the 60% overall donor growth or the 17% 10k+ donor growth might be better numbers to base projections on).
Wondering what you think the drivers of the growth are. I know you’ve been investing more in outreach recently; is this the results of that?
Ben — Thanks!
We’d guess that substantial media and general attention to GiveWell’s work probably drove the increase we saw in smaller donors. We’ve seen this in past years where we had relatively strong media coverage, and in 2015, GiveWell received a significant amount of coverage, including in new books such as William MacAskill’s Doing Good Better, Peter Singer’s The Most Good You Can Do, and Larissa MacFarquhar’s Strangers Drowning.
That said, for GiveWell’s very largest donors, we believe the increase in donations was due to our long-term approach of building a high-quality research product and reputation rather than any short-term changes to our donor outreach strategy. In almost all cases, the major donors we saw in 2015 had heard about us from another individual who spent a lot of time talking with us over the years, or had heard of us prior to 2015. Our impression is that the increase in major donations in 2015 was a reflection of our long-term approach, rather than a new outreach strategy.
You’re right that we are focusing more on donor outreach now than we have in the past, and we plan to track the impact of this work going forward. We do not expect that it had a substantial impact on our 2015 metrics.
Wow these are amazing results. Congrats to all involved and here’s to continued success.
It is good that donors are responding well to this initiative. However, there is need to involve all other stakeholders in this venture so that there is increased uptake and many more people are able to benefit. This is a very good improvement. keep it up all.
Comments are closed.