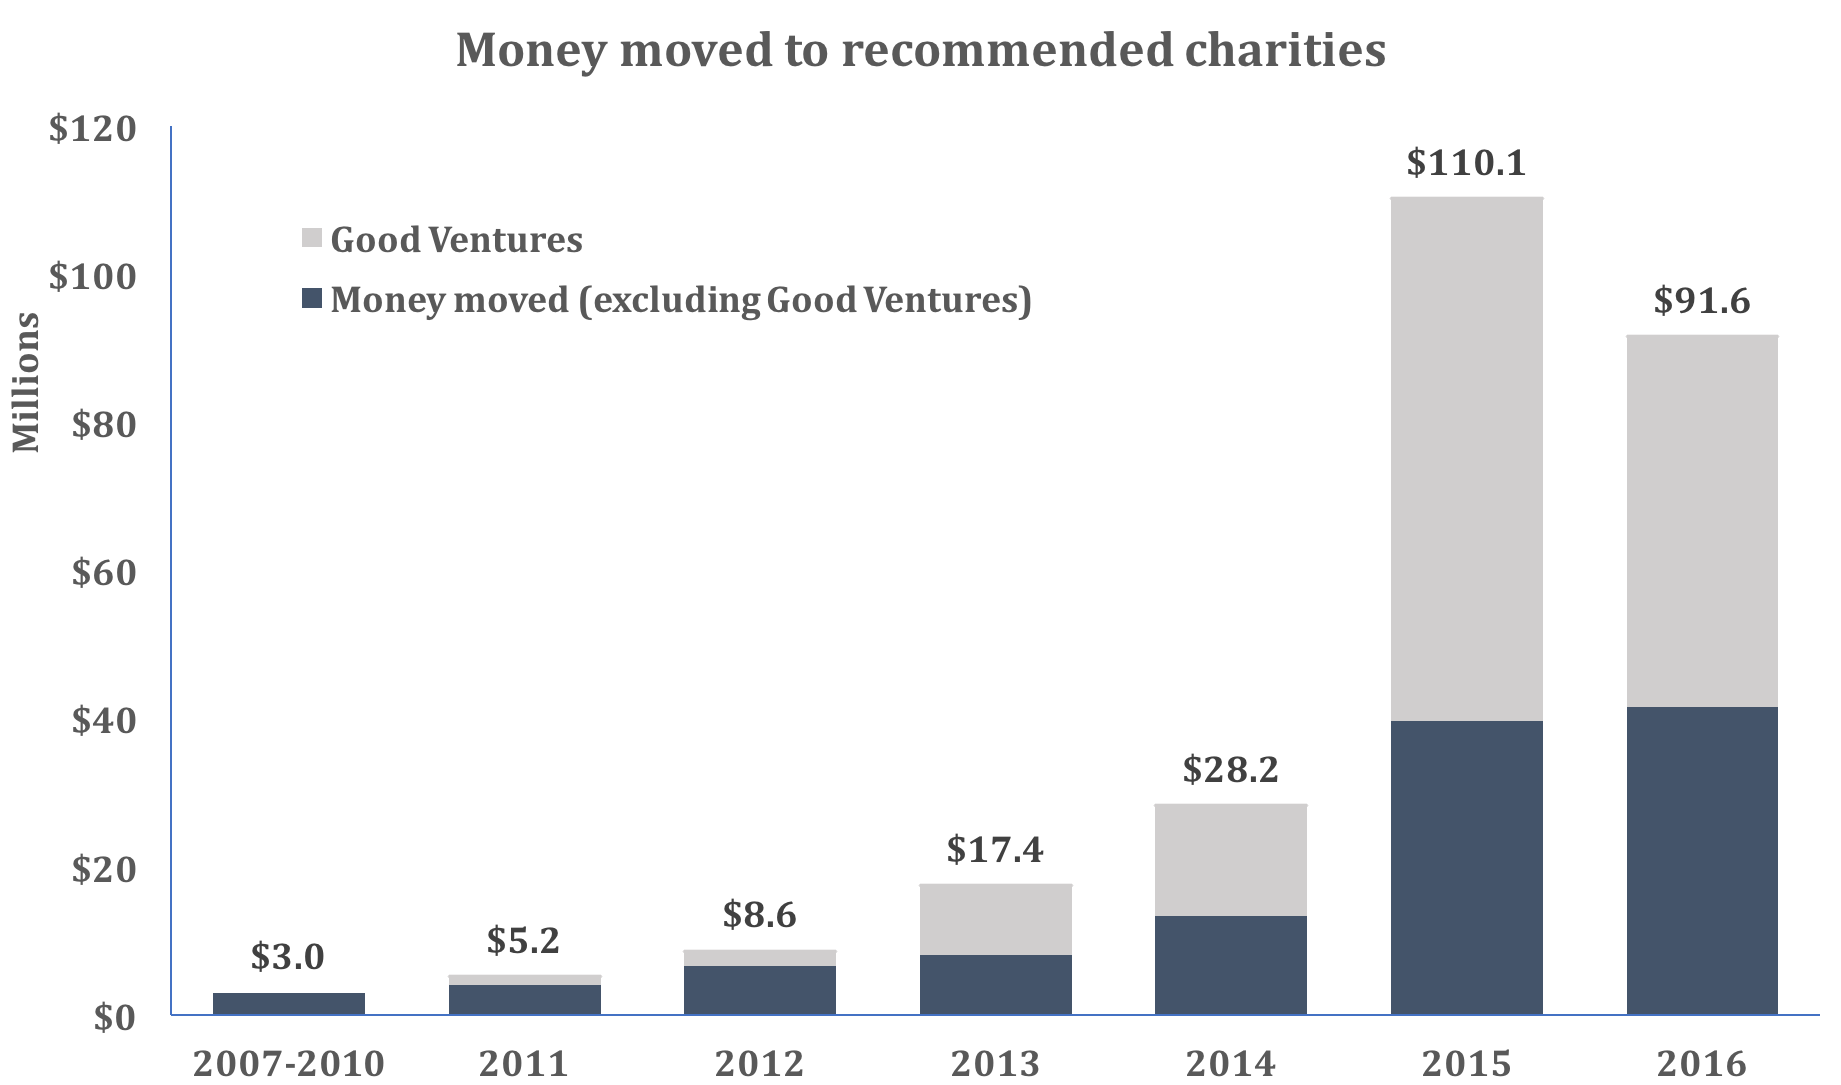
In 2016, we tracked a total of $91.6 million given to our top charities as a direct result of our research.
In addition to this $91.6 million, we also directed $13.3 million to our Incubation Grants program.
A note about this report:
We have yet to complete all of the work necessary to publish our 2016 metrics report. There are a number of reasons the report has been difficult to produce this year. In our view the main factors responsible for this delay were the increasing number and complexity of the data sources used to track donors giving to our recommended charities and competing priorities that required the attention of the staff member who produced the 2016 report. The delay was not a result of a decreased dedication to transparency.
In mid-September, we committed to publishing an update on our key metrics (money moved and web traffic) by October 1st even if we were unable to complete our report by then. We have failed to complete our full report, and, today, are publishing an interim update consistent with our commitment.
Unfortunately, we don’t have an updated estimate about when we’ll publish our full metrics report. It is possible that it will take us several months or more to complete it. We view this as a major failing on our part, and we plan to correct this in the future.
For the purpose of this report, please note:
- We report on “metrics years” that run from February through January; for example, our 2016 data cover February 1, 2016 through January 31, 2017.
- We differentiate between our traditional charity recommendations, the work of the Open Philanthropy Project, and our work aiming to support the development of future GiveWell top charities. GiveWell and Open Philanthropy are now separate legal organizations, but during 2016 Open Philanthropy was part of GiveWell, so we report its grantmaking here.
- More context on the relationship between Good Ventures, Open Philanthropy, and GiveWell can be found here.
Summary of influence:
In 2016, GiveWell influenced charitable giving in several ways. The following table includes (a) donations from donors who cited our research when donating to a third party (or cited a source that recommended our top charities because of our recommendation), (b) donations to GiveWell that we granted to top charities and standout organizations, and (c) grants made on our recommendation, through GiveWell Incubation Grants and the Open Philanthropy Project.
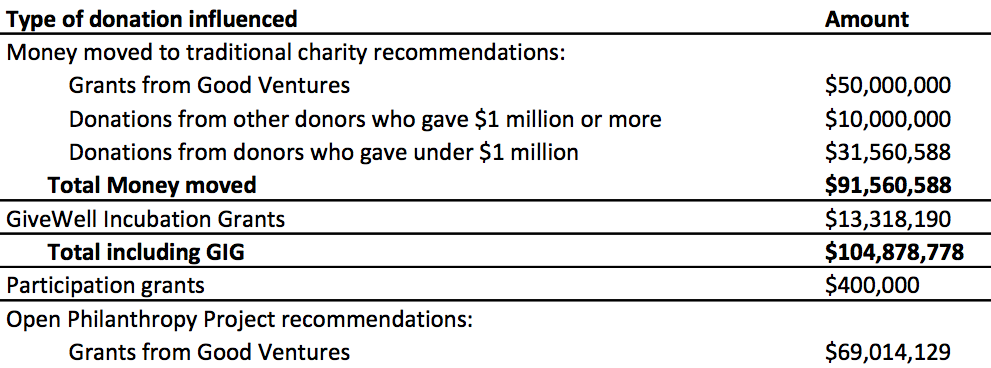
Total money moved:
In 2016, GiveWell tracked $91.6 million in money moved to our recommended charities. Our money moved figure only includes donations that we are confident were influenced by our recommendations. In our full metrics report, we plan to include our best guess of the total funding that was given to our top and standout charities due to our research; the numbers in this blog post include only donations that we could specifically track as being due to our research. The methodology used to generate the numbers in this post was very similar to what is described in our 2015 metrics report, with the exception that, for 2016, we counted more donations through partner organizations such as Giving What We Can. We now believe that we should have included those donations last year.
Open Philanthropy gave an additional $13.3 million to the GiveWell Incubation Grants program, to support the development of future top charities, and GiveWell granted $400,000 in participation grants to organizations that applied for a top charity recommendation, from funding provided by Good Ventures for this purpose. We do not count either of these grant types in our headline money moved figure.
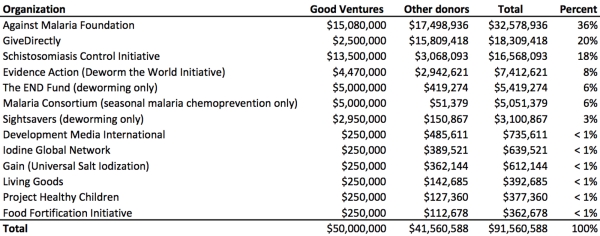
Money moved by charity:
Our seven top charities received the majority of our money moved. Our six standout charities received a total of about $3.1 million.
Addition on October 13, 2017
Although we still have not completed the full metrics report for 2016, a question from a reader prompted us to add a brief addition to this post regarding the slow growth in total money moved in 2016. We responded below in a comment and pledged to make an addition to the post itself (this addition).
The total money moved we tracked in 2016, excluding Good Ventures, grew a modest amount from $39.7 million in 2015 to $41.6 million in 2016. This 5% increase represents a sharp decline in the rate of growth of the money moved to our recommended charities on the basis of our recommendation, which is an important indicator of our impact on charitable giving. In previous years, our money moved from donors other than Good Ventures increased by 196% (2015), 65% (2014), and 23% (2013). This decrease reflects a shift in the distribution of donations from donors giving very large amounts of money to those giving more modest amounts as well as a decrease in the number of donors giving over $1 million each.
Four donors giving $1 million or more gave a combined $10 million in 2016. In 2015, eight donors donated $1 million or more to our top and standout charities for a combined $21.3 million in donations. In 2016, three of these donors kept giving at the same level. Another three didn’t repeat their donations and two reduced the size of their donations. Based on conversations with four of the five donors who reduced or didn’t repeat their donations, we don’t believe that the change in their donations reflects a change in their assessment of the quality of GiveWell’s research. In one case, we were never able to get in touch with the donor (who gave $2 million), so we don’t have more information about why their gift didn’t recur.
This decline in donations from donors giving very large amounts was offset by growth among donors giving less than $1 million, which increased from $18.4 million in 2015* to $31.6 million in 2016. The full report will contain additional details on the distribution of these donations among the different categories of donor sizes that we track, but we can currently say that we saw an increase in the number of donors giving at every level below $1 million or more. We view this growth as a positive sign that GiveWell’s donor base is broadening and may be more sustainable over time. We will complete a more thorough analysis of the changes to our donor base as part of the complete 2016 metrics report.
*We incorrectly published $18.1 million in our comment below; the correct figure is $18.4 million (see pg. 2).
Comments
Wow, that’s quite disappointing. Have you gotten any feedback (or do you have any other color) on what happened that so significantly stalled the growth in donations from sources other than Good Ventures?
Hi Ian,
Thanks for the question.
In brief, the amount donated by our largest donors (those giving $1 million or more) fell from $21.3 million in 2015 to $10 million in 2016. This was offset by growth among donors giving less than $1 million, which increased from $18.1 million in 2015 to $31.6 million in 2016.
More specifically, in 2015, 8 donors donated $1 million or more to our recommended charities. Three of these donors kept giving at the same level. Another three didn’t repeat their donations in 2016 and two reduced the size of their donations. Based on conversations with 4 of the 5 donors who reduced or didn’t repeat their donations, I don’t believe that the change in their donations reflects a change in their assessment of the quality of GiveWell’s research. In one case, we were never able to get in touch with the donor (who gave $2 million), so we don’t have more information about why their gift didn’t recur.
So, what does this all mean?
Donations that come from a larger number of donors are more robust, meaning I have more confidence that we’ll maintain and continue to grow our money moved next year than I did at the end of 2015, when more than 50% of our funding came from a very small number of very large donors.
It’s certainly possible that the fall in donations from the largest donors indicates a real shift in very large donors’ interest in our research, but based on what I know about the specific cases, I’d guess that this isn’t the case and instead believe that the amounts donated by donors giving more than $1 million in 2015 and 2016 represent random noise rather than indicating an important change in the perception of our work.
We appreciate you raising this question and think it merits an addition to our post; we plan to make this addition shortly.
Hi Devin,
Thanks for publishing the report! I am curious about why the interim update contains no web traffic information. I understand that there are logistical challenges getting all the donation data correct, but I would expect that the web traffic data should be much easier to pull up since you already have it in Google Analytics and Clicky. Or has something changed on that front?
Hi Vipul,
Thanks for the question. You are correct that it would be relatively easy, compared to other data sources, to pull the necessary information from Google Analytics and/or Clicky. The short answer is that we have not prioritized finishing the work necessary to make that data public because we have focused on finalizing data on donations. Briefly, the data on web traffic shows that visits to our site remained relatively flat and that there was a slight decline in total site traffic in 2016 compared to 2015. We are unsure about the quality of the web traffic data that we have collected, particularly in 2016, when we launched the new website design. Our impression is that the website launch may have impacted the collection of our web traffic data (we’re not sure whether this impact would be positive or negative).
@Ian, my guess is that in 2015 the numbers were skewed because it’s likely that the large, first-of-its-kind $25 million donation by Good Ventures to GiveDirectly encouraged other big donors (possibly people in the network of the Good Ventures founders) to make similar donations to GiveDirectly. I discussed this more in a section of a blog post reviewing GiveWell’s money moved estimates for 2015.
It also looks like things roughly went in the way I predicted in May 2016, as described in another section of the blog post.
Nice articles thanks for sharing
I really appreciate your work
What guidance would you give for 2017 and 2018 money moved for that core individual donors under $1M metric?
Goal from the question not to evaluate GiveWell’s future performance against that guidance, but just to get a better sense of what GiveWell expects the future donor landscape to be like.
Hi Maxwell,
Thanks for the question. We expect that we will continue to see growth in total money moved from donors giving less than $1 million per year. We are unable to confidently predict how much this figure will increase in 2017 or 2018, but there are several reasons to expect it will continue to increase.
First, we have seen consistent growth across all the categories of donors by size that we track each year for the past several years (save for donors giving over $1 million in 2016, as discussed in the post). As I noted in a comment above, we saw an increase in donations from donors giving less than $1 million from from $18.4 million in 2015 to $31.6 million in 2016. We don’t have any good reason to expect this trend to reverse, though I also do not have a good reason to think that it will grow as much as it did last year.
We also have a number of preliminary indicators in our 2017 donations data that suggest we should expect this number to continue to increase. Most convincing to me is that our 2017 data indicates that several thousand more donors have given so far in 2017 than had given at this point of 2016. We expect an increase in the total number of donors (the vast majority of whom give much less than $1 million) to lead to more total money moved. We also know about roughly $1.2 million more in donations from donors giving less than $50,000 relative to what we knew about at this date last year; we’re not sure to expect this trend in each category of donor size, but this also suggests growth to us.
Finally, we know we are missing some data for 2017 on donations made directly to our recommended charities, so I would expect that these positive indicators are understating how much growth there has been. (I would caveat that none of our data for 2017 has been carefully vetted yet.)
Although the data we have on hand is insufficient to make a precise prediction of what is likely to happen in 2017 or 2018, the signs all appear positive to us right now and we are unaware of any reason to expect that our influence on charitable giving will decrease in 2017 or 2018. We’re also putting more organizational focus on outreach about our work, and we hope that, in turn, leads to increased growth in the money we’re directing to our top charities.
I expect that the money donated to our recommended charities by donors giving less than $1 million will increase by at least a few million dollars in 2017, and perhaps much more than that. I would be surprised if it decreased.
Devin,
Thanks for the detailed response! Really useful. And great to hear that the early 2017 data looks so strong. I also really do appreciate you making the “at least a few million dollars” estimate given the uncertainty around that kind of guess.
I like making that <$1M donations metric (or something similar) more central in this kind of reporting – maybe breaking up the retail partition into =1M in the standard retail/GoodVentures column graph. As long as GiveWell keeps growing its donor base and keeps becoming less niche and more mainstream, its prospects for total money moved growth are really bright.
Comments are closed.