It’s been roughly a month since the devastating 9.0 earthquake in Japan. We’ve been continuing to follow the situation and re-examine our recommendations for donors. At this point we feel that
- The situation in Japan has recently worsened, with aftershocks and negative developments regarding the nuclear crisis. It is too early to tell whether this will change our take on the government’s ability to finance an appropriate relief/recovery effort (which in turn would leave room for donations to do more good).
- Putting the recent worsening aside and looking at new information over the past couple of weeks, we feel there is a slightly stronger case than before against our bottom line, but not strong enough to overturn our recommendations. We still recommend Doctors Without Borders, which helps with relief and recovery efforts worldwide (including far less well-resourced efforts). For those looking to help Japan specifically, the Japanese Red Cross is the best option we see.
Details follow.
Update on OCHA and ReliefWeb
It remains the case that – as we have observed in past updates – the Financial Tracking System lists appeals for many countries but lists no appeal for Japan (archived).
In our previous update, we cited a staffer as stating that the lack of an official appeal reflected “the Japanese national capacity to respond.” Now OCHA has made more explicit official statements than before about the need for assistance.
- A March 28 situation report stated:
the need for any further international humanitarian presence or internationally procured relief supplies is limited and any such assistance should only be provided upon the request of the Japanese Government and in accordance with their stated criteria. In addition it is important not to overburden affected prefectures and local communities who are working at full capacity and do not have the resources to coordinate unsolicited offers of assistance
- The latest OCHA report is from April 1 (archived) and states:
- It is still unknown how many people are living outside evacuation centres but the number is certainly large. Many people who were originally living in evacuation centres have returned to their homes even if they were damaged and without water and power. These people do not receive basic supplies from the municipal authorities but are becoming the focus of attention by local NGOs and volunteers …
- The team notes that whilst coordination challenges remain the Government of Japan can and will cover the needs of the affected population and that, with some very specific exceptions and then only at the direct request of the Government, there is no requirement for further international assistance at this time …
- OCHA has officially ended its support role in-country to the Government of Japan for the emergency. NGO consortia Japan Platform and Japan NGO Center for International Cooperation will take the lead in information exchange and coordination of international NGOs with their local partners.
Update on major funders
In our previous update, we did a very rough comparison of the responses to disasters in Haiti and Japan by major funders, i.e., governments and foundations. Since then, we have been pointed to a better source of data on aid from the U.S. specifically, which allows us to directly compare aid in the month after the Haiti earthquake to the month after the Japan earthquake.
We compiled data from Haiti fact sheets and Japan fact sheets into this spreadsheet (XLS). This chart shows total aid to each country from all USAID sources, with the number of days after the disaster (1/13/2010 for Haiti; 3/11/2011 for Japan) on the x-axis:
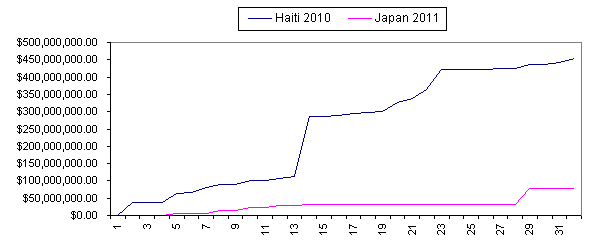
Haiti received funds from six different USAID agencies, while Japan received funds from only two: the Department of Defense (DoD) and the Office of Foreign Disaster Assistance (OFDA). DoD provided $252 million worth of aid to Haiti in the first month, vs. just over $70 million to Japan (likely mostly in the form of direct assistance rather than cash). OFDA provided just over $200 million to Haiti, vs. ~$7 million to Japan (nearly all of which was committed within the first week).
As we observed in our previous update, we find it unlikely that the U.S. would provide less aid to Japan (an ally) than it had to Haiti, unless it perceived limited needs for its assistance.
We haven’t done similar analysis of aid from other governments. The ratio between U.S. aid and total aid from other governments is about the same now as it was in our previous update (the U.S. has given about 2x as much as all other governments combined).
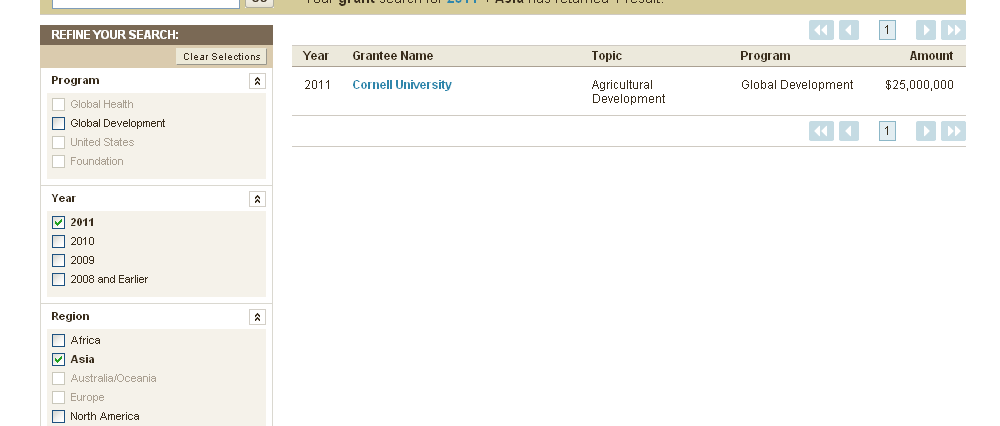
Another change since our last update is that the Gates Foundation made a $1 million grant to Mercy Corps, which we questioned it about (and posted its answers).
Update on the Japanese government
- The OCHA report linked above states that “The Government of Japan has received 134 offers of assistance from countries as well as 39 offers from international organizations. It has accepted relief items from 29 countries and international organizations.”
- An AlertNet story about the possible future impact of a future earthquake in Tokyo states:
“Japan has enough savings surplus to fund reconstruction of (the quake-hit northeast) … but if you had to multiply the costs for Tokyo, Japan would become dependent on foreign funds,” said Jesper Koll, director of equities research at JP Morgan in Tokyo.
Along with the Moody’s statement in our last update, this is an additional reason to believe that the government can finance an appropriate relief/recovery effort. As a side note, this article makes the disturbing argument that a 7.3 earthquake (much less severe than the one that hit Sendai) could be even more devastating than this earthquake if it hit Tokyo – and this disaster has a high chance of occurring over the next 30 years.
- I haven’t seen much criticism of the government’s relief effort (as opposed to its response to the ongoing nuclear crisis), but the Economist gives harsh criticism and implies that the government has not done what it could:
- For all that Mr Kan has attempted to be seen at the front, in Tokyo the sense of a looming humanitarian crisis in the north has been slow to sink in. That is partly because nuclear worries have absorbed much of the government’s attention. Few politicians in a centralised system have bothered to travel north themselves. The media, taking their cue from the Tokyo establishment, have not thought properly to report the unfolding struggle for food and fuel.
- Yet businessmen and victims say supplies are being held up as bureaucracies fall back on tired old rules and straitjacket procedures. Lorries full of supplies have been unable to get petrol on the empty expressway north, reserved for “emergency” vehicles. While this severe shortage of fuel spread through northern Japan, oil companies were sitting on huge supplies which by law they had to keep in reserve. If ever an occasion for their use was justified, it was this catastrophe. Yet the government took ten days to beg for (not order) their release. From the start, Mr Kan should have declared a state of emergency. Even now, clear lines of authority for handling the many-headed crisis have not been properly established.
- The worsening of the situation with recent events may make it harder for the government to fully fund the recovery effort: “The government and main opposition party have agreed to a spending package to get some reconstruction work started, but setting a large additional budget will be difficult due to Japan’s heavy debt burden.”
Japanese Red Cross
- The latest Japanese Red Cross information bulletin is from March 28 (archived). (As a side note, the list of updates I was using before seems to have disappeared (see this page as it appeared previously).) Like the previous information bulletin (discussed in our last update), it has somewhat difficult-to-interpret language regarding donations: “JRCS is receiving cash contributions from some Red Cross Red Crescent National Societies in the spirit of solidarity.”
- We have learned that Red Cross societies do not generally use the Reliefweb system for appeals (a search for appeals on Reliefweb from Red Cross societies yields very few results). Therefore, the fact that the Japanese Red Cross has not appealed through this system is not evidence against room for more funding; its lack of an appeal through the Red Cross system was discussed in our last update.
- In past updates, we stated that the Japanese Red Cross appeared to be planning direct cash distributions to survivors, but that this was not entirely clear. Media reports since then have clarified the situation: an Alertnet story explicitly states that “The 108 billion yen ($1.26 billion) of relief money is meant to be handed to disaster victims in cash.” (The L.A. Times states this as well.) As stated in earlier updates, we support the idea of cash distributions to survivors.
- There has been some criticism (see the links immediately above) that distribution has been too slow; the Red Cross’s response is essentially that it is difficult to distribute so much money both quickly and fairly.
International charities
The Chronicle of Philanthropy (archived) reports $246.9 million in donations, most of it to the American Red Cross ($169.5 million), Americares ($5.4 million), Catholic Relief Services ($4.9 million), Mercy Corps ($6.6 million), the Salvation Army (~$5.6 million), Save the Children ($9.6 million), United Way Worldwide (~$10 million) and World Vision ($7.9 million).
As in previous updates, we scanned the websites of particularly prominent charities (including those listed directly above) to see what they are disclosing about their activities. In general, they seem to be focused on distribution of various supplies and on maintaining various forms of “child-friendly spaces” and psychosocial support.
- Americares reports a “relief shipment, sent from AmeriCares warehouse in Connecticut at the invitation of the Japanese government … Containing over 17 tons of medicines, medical supplies and hygiene items, the shipment, valued at more than $525,000 will be received by AmeriCares partner, the Tohoku University Hospital.”
- Catholic Relief Services (archived) states that it is not involved in immediate relief but plans on being involved in long-term recovery (specifics are not given).
- Mercy Corps (archived) has been posting frequent updates; it appears to be working with a local partner on both immediate relief and longer-term recovery (we have discussed the latter in a previous post).
- Salvation Army (archived) states that 100% of donations will be sent to the Salvation Army Japan (archived), whose last update (March 14) states that it “has three emergency service relief teams operating in areas devastated by the earthquake and tsunami” and that “Arrangements are being made for emergency service personnel from The Salvation Army International Headquarters (IHQ) to go to Japan to assist with the Army’s relief effort.”
- Save the Children (archived) has posted a briefing document emphasizing distribution of supplies (mostly not specified, aside from “back-to-school supplies”), construction of “Child-Friendly Spaces” and “psychosocial support.” Its longer-term plan includes a fund to “appeal for, assess and award grants to national and community groups involved in re-establishing child care and education” and pursuing advocacy toward the goal that “Child Friendly Spaces and childcare services are included in all prefecture planning, preparation and response operations.”
- United Way Worldwide (archived) states that “The Central Community Chest of Japan has helped provide supplies to volunteer centers including: bicycles, mattresses, cell phones, and laptops. Additional supplies requested by the volunteer centers include motorbikes, prefab houses and tents, copy and fax machines, PCs and printers.”
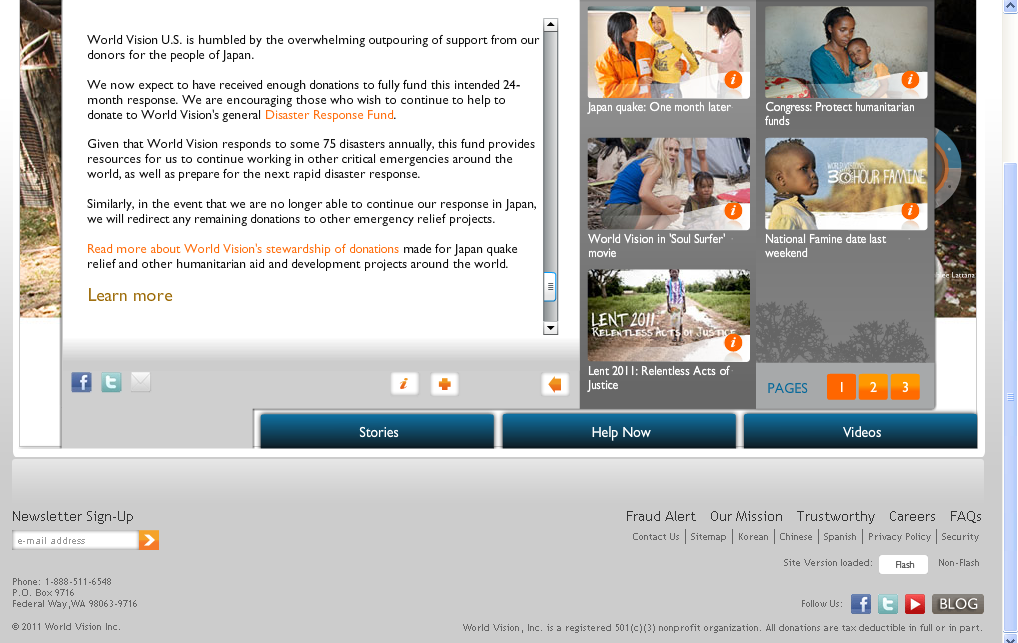
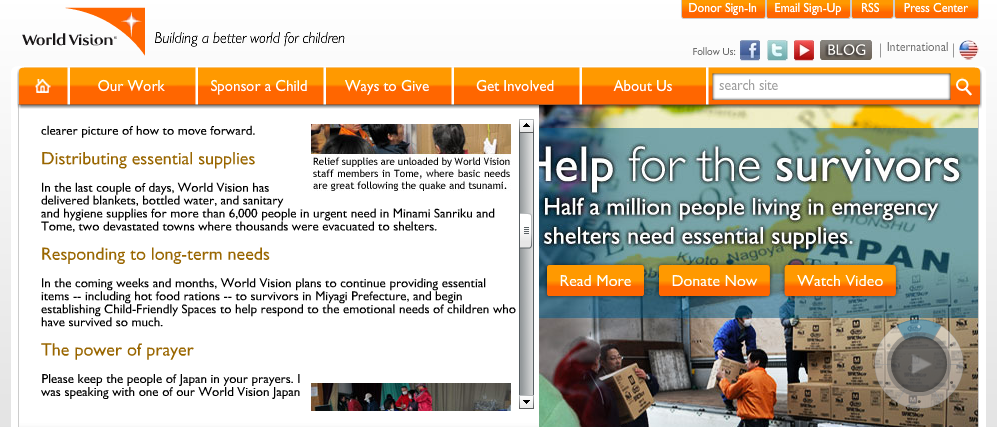
- World Vision states, “We now expect to have received enough donations to fully fund this intended 24-month response. We are encouraging those who wish to continue to help to donate to World Vision’s general Disaster Response Fund.” Regarding the specifics of its activities, it states that “we will focus on further distribution of relief and recovery items, continuing to set up protection programs for children and the elderly, while establishing community kitchens in affected areas” but is not specific about longer-term plans (“World Vision will be looking at how to best support families by providing necessary supplies to … shelters”).
- Doctors Without Borders (archived) has put out one update since our last update, stating that “A team of six MSF psychologists have started working with the survivors of the massive earthquake and tsunami that hit northeast Japan on March 11.”
We have included the most substantive information we could find in most cases; the websites are generally fairly light on details. We have not seen any nonprofit that appears to be planning to distribute cash directly to survivors, as the Japanese Red Cross is.
A BBC article also notes that the UK’s Disasters Emergency Committee, which “coordinates the efforts of 13 UK charities during international crises” has refrained from an appeal for Japan.
We continue to be concerned about the idea that these organizations may be more interested in the appearance of helping (and the money that comes with it) than in being as helpful as possible (which, according to OCHA, could often mean staying out of the way). As discussed previously, the apparent lack of emphasis on cash gifts to survivors (for the longer-term phase) contributes to this concern.
Japanese charities
The OCHA report discussed above mentions three sources of coordination/information on nonprofits’ efforts (note that the second two of these links are in Japanese, and I am working off translations from the Google Chrome browser):
- The Japan Platform (archived) has posted three updates since our last update. A couple of highlights:
- The April 1 set of recommendations for international NGOs states that “it is generally not lack of relief supplies which is a problem, but more for the issue of better coordination to reach the needy. JPF and JANIC are trying to fill the gap of the needs from the field, and we are grateful for your understanding and long term support.” It also states that “Some Japanese NGOs, which are well organized and self-sustainable (food, accommodation, and communication etc.), have started their activities.” It advises international NGOs to consider partnering with Japanese nonprofits and to coordinate closely with local Disaster Volunteer Committees.
- The latest general update has a table (page 6) and map (page 7) giving very broad overviews of nonprofits’ activities and funding. Many, but not all, local nonprofits seem to be in the “assessment” phase. The table gives financial figures in yen for broad activities, which I would guess refer to expected expenses. The figures are difficult to read, but I estimate that they add up to about 166 million yen; private donations are reported at a little over 3.8 billion yen.
- JANIC (archived) has posted 8 updates since our last update, but nothing that appears to shed light on the activities and needs of nonprofits.
- Japan Civil Network for Disaster Relief in East Japan (archived) was not discussed in our last update. It provides a large list of participating organizations but no other information that I can find on activities and funding needs.
Bottom line
In my view, the case against our previous bottom line has strengthened slightly for two reasons:
- There have been accusations of slow/insufficient responses by the Japanese government and Red Cross, and if true these would leave more room for nonprofits to add value even if not invited/funded to do so by the government and Red Cross. We don’t know how valid these accusations are.
- Nonprofits have published more substantive information than before on their activities, and there is not as much language implying that they are still essentially on standby. That said, the overall substantiveness of the reports is still generally low, and the focus on providing services (rather than cash) over the long term concerns us. In addition, just because nonprofits are active doesn’t mean that (a) their assistance is adding value relative to the government and Red Cross; or (b) they have room for more funding.
A donation to one of the local coordinating bodies (Japan Platform, JANIC, Japan Civil Network for Disaster Relief in East Japan) may result in aid being delivered somewhere the government and Red Cross aren’t reaching. However,
- Criticism of the official relief effort still appears relatively rare to us and we don’t know how credible such criticism it is (we’d expect some criticism even of the best relief effort, given the difficulty of the situation).
- Looking at the words and actions of OCHA and government funders still paints a picture of very limited overall needs for non-government assistance.
- The numbers we have imply that nonprofits have gotten more than enough funding for what they are planning.
- The reasons we gave previously for preferring the Red Cross to other nonprofits, if you are intent on having your funds spent in Japan, still stand.
-
Therefore, we stand by our previous bottom line.