This is the fourth post (of six) we’re planning to make focused on our self-evaluation and future plans.
This post answers a set of critical questions for GiveWell stakeholders. The questions are the same as last year’s.
Is GiveWell’s research process “robust,” i.e., can it be continued and maintained without relying on the co-Founders?
Where we stood as of Feb 2011
We had two full-time, non-co-founder employees (analysts), a part-time employee, and plans to hire another in the summer. We wrote that, in total, we expected to have 3.5 analysts by the Fall of 2011.
Progress since Feb 2011
By the summer of 2011, we had 3 full-time analysts and two temporary summer analysts. One of our full-time analysts left in December 2011; we recently hired one of our former summer analysts, bringing us back to 3 full-time analysts.
The analysts have been with us different levels of time, but as they have been at GiveWell longer, each has continued to take on more responsibility.
Where we stand as of February 2012
We currently have 3 full-time analysts, and have made an offer to an analyst who will start in July, which would bring GiveWell to 4 full-time analysts. We continue to focus on recruiting and hope to reach 6 full-time analysts (8 total employees) summer 2012.
Analysts take the lead on most charity investigations; co-founders may provide basic guidance and sign off on work before it is published. GiveWell Labs, because of its experimental nature, will be led for the time being by co-founders.
What we can do to improve
- We continue to experience turnover. Two analysts who worked with us in 2011 have since left GiveWell. We don’t believe that turnover is indicative of a problem – GiveWell is a unique environment that fits some people and not others and we would not be surprised if turnover remains relatively high in the near future. We have tried to address turnover by improving our hiring process to select for the characteristics most likely to lead to success at GiveWell.
- In the past, we have exclusively hired “generalists” i.e., young, largely college-graduates who work on a little bit of everything at GiveWell – e.g., charity reviews, speaking with donors, answering emails, in-depth literature reviews. In the coming year, we plan on putting more thought into hiring people for more specialized roles, such as administration (we now have enough administrative work for a full-time hire) and literature reviews.
Does GiveWell present its research in a way that is likely to be persuasive and impactful (i.e., is GiveWell succeeding at “packaging” its research)?
Where we stood as of Feb 2011
We wrote, “We’re currently satisfied with the presentation of our content and don’t plan on emphasizing this goal in the near future.”
Progress since Feb 2011
None. This was not a priority over the past 12 months.
Where we stand as of February 2012
As traffic to our website has increased over the past 12 months, we would guess that the importance of better packaging our research has risen. In particular, we feel our site is poorly suited to donors who want to spend more than a few minutes but less than an hour on our site. (We have designed the site to make quick action easy and to provide significant depth, but we have no “middle level” of depth for gaining some information relatively quickly.)
What we can do to improve
We have a list of ideas for how to better package our research, and we may prioritize this in 2012. In particular, we are considering putting more work into a “middle level of detail” as described above.
Does GiveWell reach a lot of potential customers (i.e., is GiveWell succeeding at “marketing” its research)?
Where we stood as of Feb 2011; progress since Feb 2011; where we stand as of February 2012
As detailed previously, our growth remains robust:
- We tracked over $5 million to our recommended charities in 2011 compared to approximately $1.5 million in 2010.
- The number of donors who gave to our recommended charities grew by about 3x in 2011 compared to 2010.
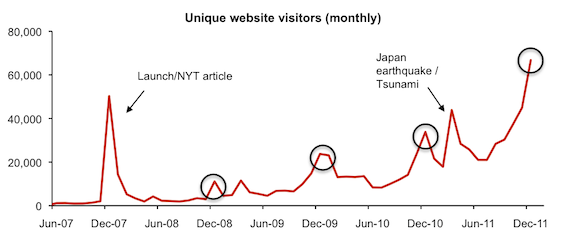
- Our website traffic roughly doubled in 2011 compared to 2010.
As long as we continue to grow at ~2-3x (which continued thus far in 2012), we will consider our growth to be strong, and will not consider outreach to be an urgent priority.
What we can do to improve
We continue to consider ideas to improve our reach, but at this point, don’t feel that increasing our reach is as important as improving the quality and packaging of our research (discussed above).
We feel that the most important strategy for improving our reach is to develop GiveWell Labs into a strong product, since this would open up a new audience that could potentially be an excellent fit with us and make a large difference for our influence.
We will maintain two strategies that we feel are effective at bringing attention to our work:
- Regular blog posts (we generally aim for one per week). In surveying the major donors who comprise the bulk of our money moved, we found that they emphasized the blog as a key way that they engage with our work. In addition, looking at the sources of growth in our metrics report, we believe that a substantial amount of our growth in referral traffic is due to content we published on the blog.
- Our research on disaster relief, which we maintain mostly for outreach reasons. In 2011, our report on the March crisis in Japan drew significant attention (and the associated traffic spike is visible); our report on the East Africa famine also drew some attention (a blog post on the topic was our third most-trafficked post of the year with over 6000 visits; our top two most-trafficked posts were both on the Japan crisis).
Is GiveWell a healthy organization with an active Board, staff in appropriate roles, appropriate policies and procedures, etc.?
Where we stood as of Feb 2011
We were happy with our board and policities, but wrote, “we have a significant need for more operating support and intend to make this a major priority for 2011.”
We also wrote:
We aim to raise operating support by
- Applying for support from major institutional funders.
- Having discussions with people who have a substantial history of being close to our project, including Board members and major “customer donors” (i.e., donors who have used our research to decide where to give), about the possibility of their supporting GiveWell directly.
We plan to continue to avoid soliciting funds from the public at large. We wish to avoid “competing with” our recommended charities for funding, and feel our credibility would be hindered if we were asking for money ourselves.
Progress since Feb 2011
We closed our funding gap using the approaches laid out above, raising funds from both institutional funders and “customer donors” who had a substantial history of being close to GiveWell.
Where we stand as of February 2012
We project revenues that will meet expenses for 2012 and currently have what we consider a safe level of cash reserves. We project a deficit for 2013 but expect to be able to fund the gap using the strategies laid out above.
What we can do to improve
Financials:
We intend to continue taking opportunities to raise funds for GiveWell operations when the opportunities present themselves, but do not intend to make fundraising for GiveWell one of our primary priorities (or uses of time) for 2012.
Board:
Our current Board of Directors is more or less the same as it was in 2008. 2012 may be the right year to consider reorganizing the board.
What is GiveWell’s overall impact, particularly in terms of donations influenced? Does it justify the expense of running GiveWell?
In 2010, we had expenses of less than $315,000 and money moved of approximately $1.5 million, a ratio of 4.8:1. Our loose, long-term target was at least a 9:1 ratio of money moved to operating expenses.
In 2011, we had money moved of over $5 million with expenses of $356,000, a ratio of 14:1.
$1.75 million of the $5 million came from grants from Good Ventures and pre-commitments to GiveWell Labs, neither of which will necessarily repeat in 2012. However, the remaining $3.25 million alone would produce an approximately 9:1 ratio.