In addition to evaluations of other charities, GiveWell publishes substantial evaluation on itself, from the quality of its research to its impact on donations. We publish quarterly updates regarding two key metrics: (a) donations to top charities and (b) web traffic.
The charts below present basic information about our growth in money moved and web traffic thus far in 2012.
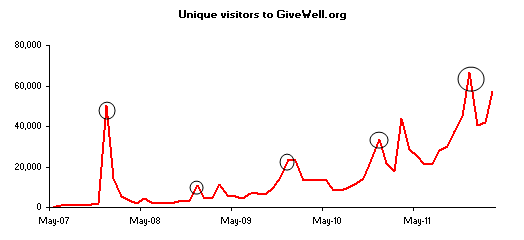
Website traffic tends to peak in December of each year (circled in the chart below). Growth in web traffic has remained strong.
Growth in money moved has remained strong as well. The majority of the funds GiveWell moves comes from a relatively small number donors giving larger gifts. These larger donors tend to give in December, and we have found that growth in donations from smaller donors throughout the year tends to provide a reasonable estimate of the growth from the larger donors by the end of the year.
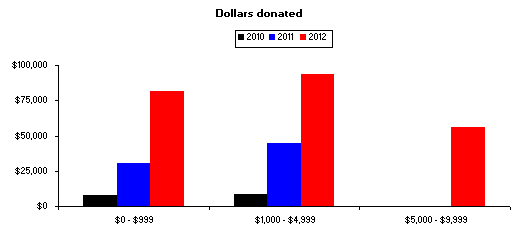
Below, we show two charts illustrating growth among smaller donors.
Thus far in 2012, GiveWell has directed $228,351 to our top charities from donors giving less than $10,000. This is approximately 3x the amount we had directed at this point last year.
Most donors give less than $1,000; the chart below shows the growth in the number of smaller donors giving to our top charities.
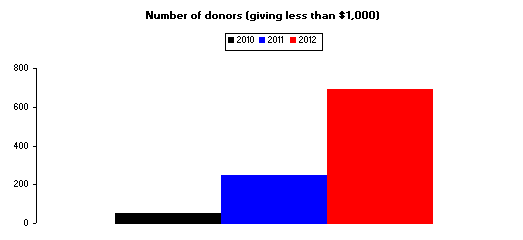
Overall, 760 donors have given to GiveWell’s top charities this year (compared to 274 donors at this point last year).
In total, GiveWell donors have directed $631,879 to our top charities this year, compared with $456,567 at this point in 2011. For the reason described above, we don’t find this number to be particularly meaningful at this time of year. One major difference between 2011 and 2012 is that in 2011, Ken Jennings allocated the $150,000 he won participating in a Jeopardy! contest against IBM’s Watson to VillageReach.