In September 2017, we posted an interim update on GiveWell’s 2016 money moved and web traffic. This post summarizes the key takeaways from our full 2016 money moved and web traffic metrics report. Note that some of the numbers, including the total headline money moved, have changed since our interim report. Since then, we decided to exclude some donations from our headline money moved figure (details in the full report), and we corrected some minor errors.
This report was highly delayed (as discussed in the interim update). We expect to publish our report on GiveWell’s 2017 money moved and web traffic much more quickly; our current expectation is that we will publish that report by the end of June.
GiveWell is dedicated to finding outstanding giving opportunities and publishing the full details of our analysis. In addition to evaluations of other charities, we publish substantial evaluation of our own work. This post lays out highlights from our 2016 metrics report, which reviews what we know about how our research impacted donors. Please note:
- We report on “metrics years” that run from February through January; for example, our 2016 data cover February 1, 2016 through January 31, 2017.
- We differentiate between our traditional charity recommendations and our work on the Open Philanthropy Project, which became a separate organization in 2017 and whose work we exclude from this report.
- More context on the relationship between Good Ventures and GiveWell can be found here.
Summary of influence: In 2016, GiveWell influenced charitable giving in several ways. The following table summarizes our understanding of this influence.
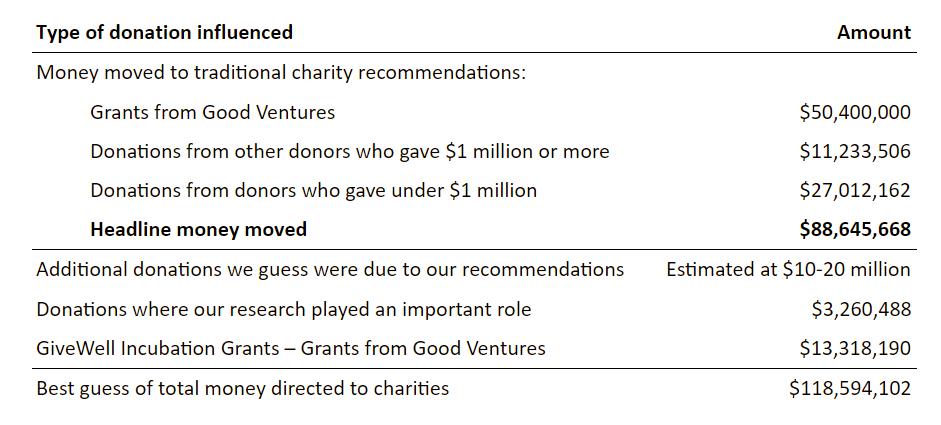
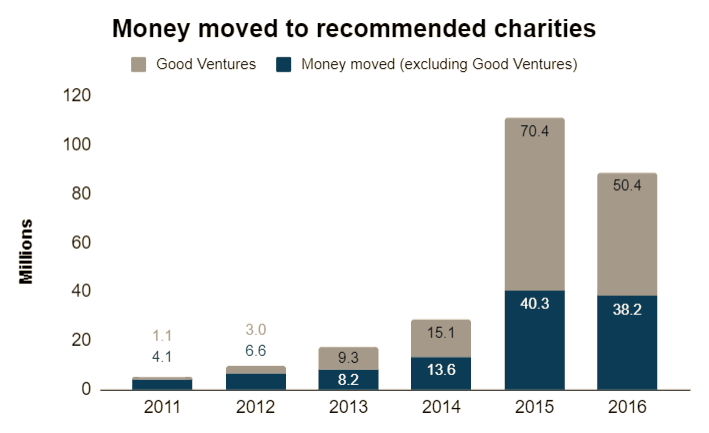
Headline money moved: In 2016, we tracked $88.6 million in money moved to our recommended charities. Our money moved only includes donations that we are confident were influenced by our recommendations.
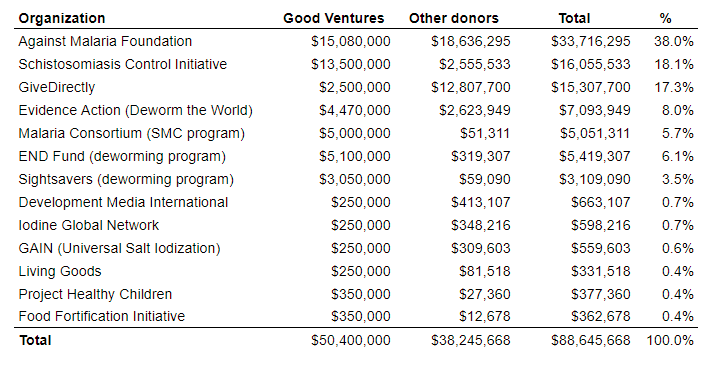
Money moved by charity: Our seven top charities received the majority of our money moved. Our six standout charities received a total of $2.9 million.
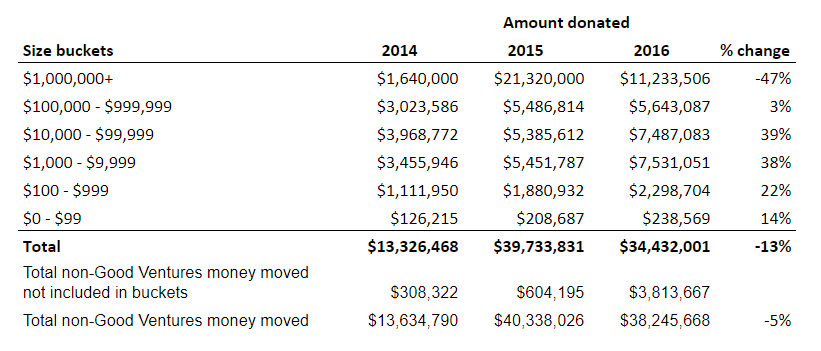
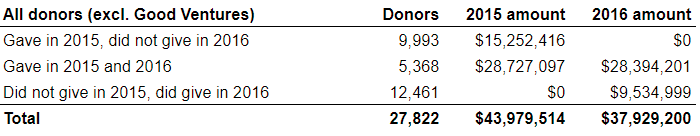
Money moved by size of donor: In 2016, the number of donors and amount donated increased across each donor size category, with the notable exception of donations from donors giving $1,000,000 or more. In 2016, 93% of our money moved (excluding Good Ventures) came from 19% of our donors, who gave $1,000 or more.
Donor retention: The total number of donors who gave to our recommended charities or to GiveWell unrestricted increased about 16% year-over-year to 17,834 in 2016. This included 12,461 donors who gave for the first time. Among all donors who gave in the previous year, about 35% gave again in 2016, down from about 40% who gave again in 2015.
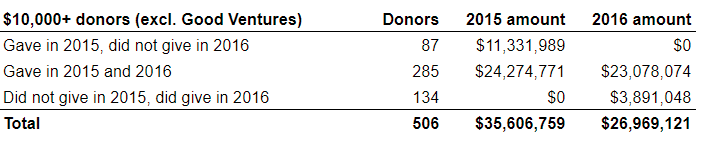
Our retention was stronger among donors who gave larger amounts or who first gave to our recommendations prior to 2014. Of larger donors (those who gave $10,000 or more in either of the last two years), about 77% who gave in 2015 gave again in 2016.
GiveWell’s expenses: GiveWell’s total operating expenses in 2016 were $5.5 million. Our expenses increased from about $3.4 million in 2015 as the size of our staff grew and average seniority level rose. We estimate that about one-third of our total expenses ($2.0 million) supported our traditional top charity work and about two-thirds supported the Open Philanthropy Project. In 2015, we estimated that expenses for our traditional charity work were about $1.1 million.
Donations supporting GiveWell’s operations: GiveWell raised $5.6 million in unrestricted funding (which we use to support our operations) in 2016, compared to $5.1 million in 2015. Our major institutional supporters and the five largest individual donors contributed about 70% of GiveWell’s operational funding in 2016. This is driven in large part by the fact that Good Ventures funded two-thirds of the costs of the Open Philanthropy project, in addition to funding 20% of GiveWell’s other costs.
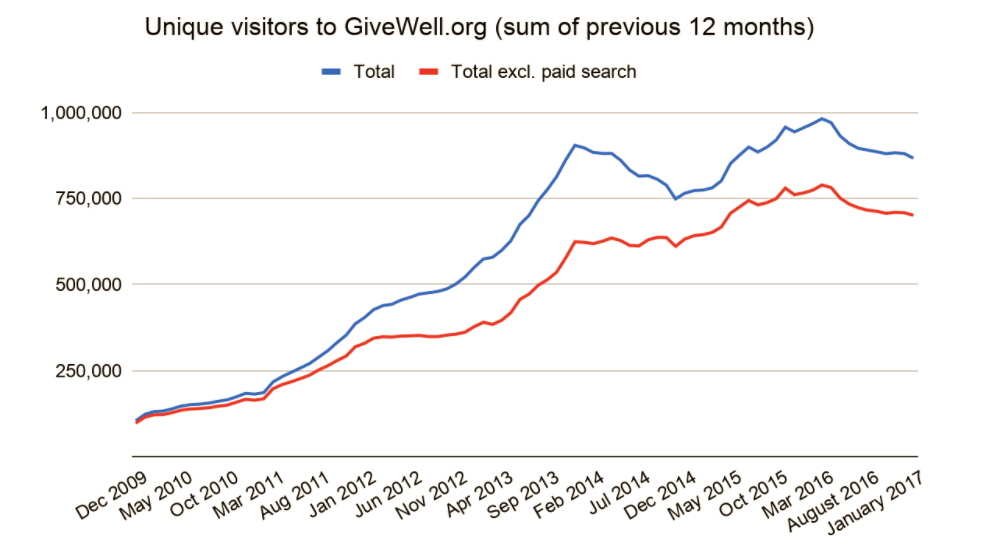
Web traffic: The number of unique visitors to our website was down very slightly (by 1%) in 2016 compared to 2015 (when excluding visitors driven by AdWords, Google’s online advertising product).
For more detail, see our full metrics report (PDF).
Comments
Interesting. Do you have any color on why there was this large drop in 7-figure gifts? Was 2015 just anomalous in some way?
Hi Ian, our best guess is that the drop in donations of at least $1 million is due to largely-random fluctuation in giving rather than a change in how donors perceive or value GiveWell’s research. The number of donors in this category is quite small: 8 donors in 2015 and 4 donors in 2016. This comment has some additional information.
Comments are closed.