Added October 2022: From 2020 to 2022 we used the name “Maximum Impact Fund” to refer to the fund used to support the highest-priority funding needs among our top charities each quarter. In September 2022, we changed the name of this fund to the “Top Charities Fund” to better describe what opportunities this fund supports; more information here.
GiveWell donors contributed over $150 million to our recommended charities in 2019. This is the first year in our 13-year history we have reached this remarkable milestone.
While it is easy to celebrate this large headline figure, we should not lose sight of the transformative impact this number represents, nor should we overlook the compassion and generosity of the donors behind these dollars. We estimate that donations made to our top charities in 2019 will:
- Avert the deaths of between 19,000 and 32,000 people,
- Provide parasitic worm treatments to over 12 million children, and
- Deliver unconditional cash transfers to over 14,000 families.[1]
The research we do to identify and recommend charities is only one part of the equation—it is the generosity of donors that turns our recommendations into tangible impact. It is a privilege to partner with donors to create real, measurable change and to direct funding where it can make the most difference in people’s lives. Thank you to our community of donors.
While we shared a preliminary update in February on the funding we directed to our recommended charities in 2019 (our “2019 money moved”), we have since completed all data gathering to present a full and complete picture of funding in 2019. This post lays out highlights from our final 2019 money moved report and shares more details about how donors gave to GiveWell’s recommended charities in 2019.[2]
Summary of influence: In 2019, GiveWell influenced charitable giving in several ways. The following table summarizes our understanding of this influence.[3]
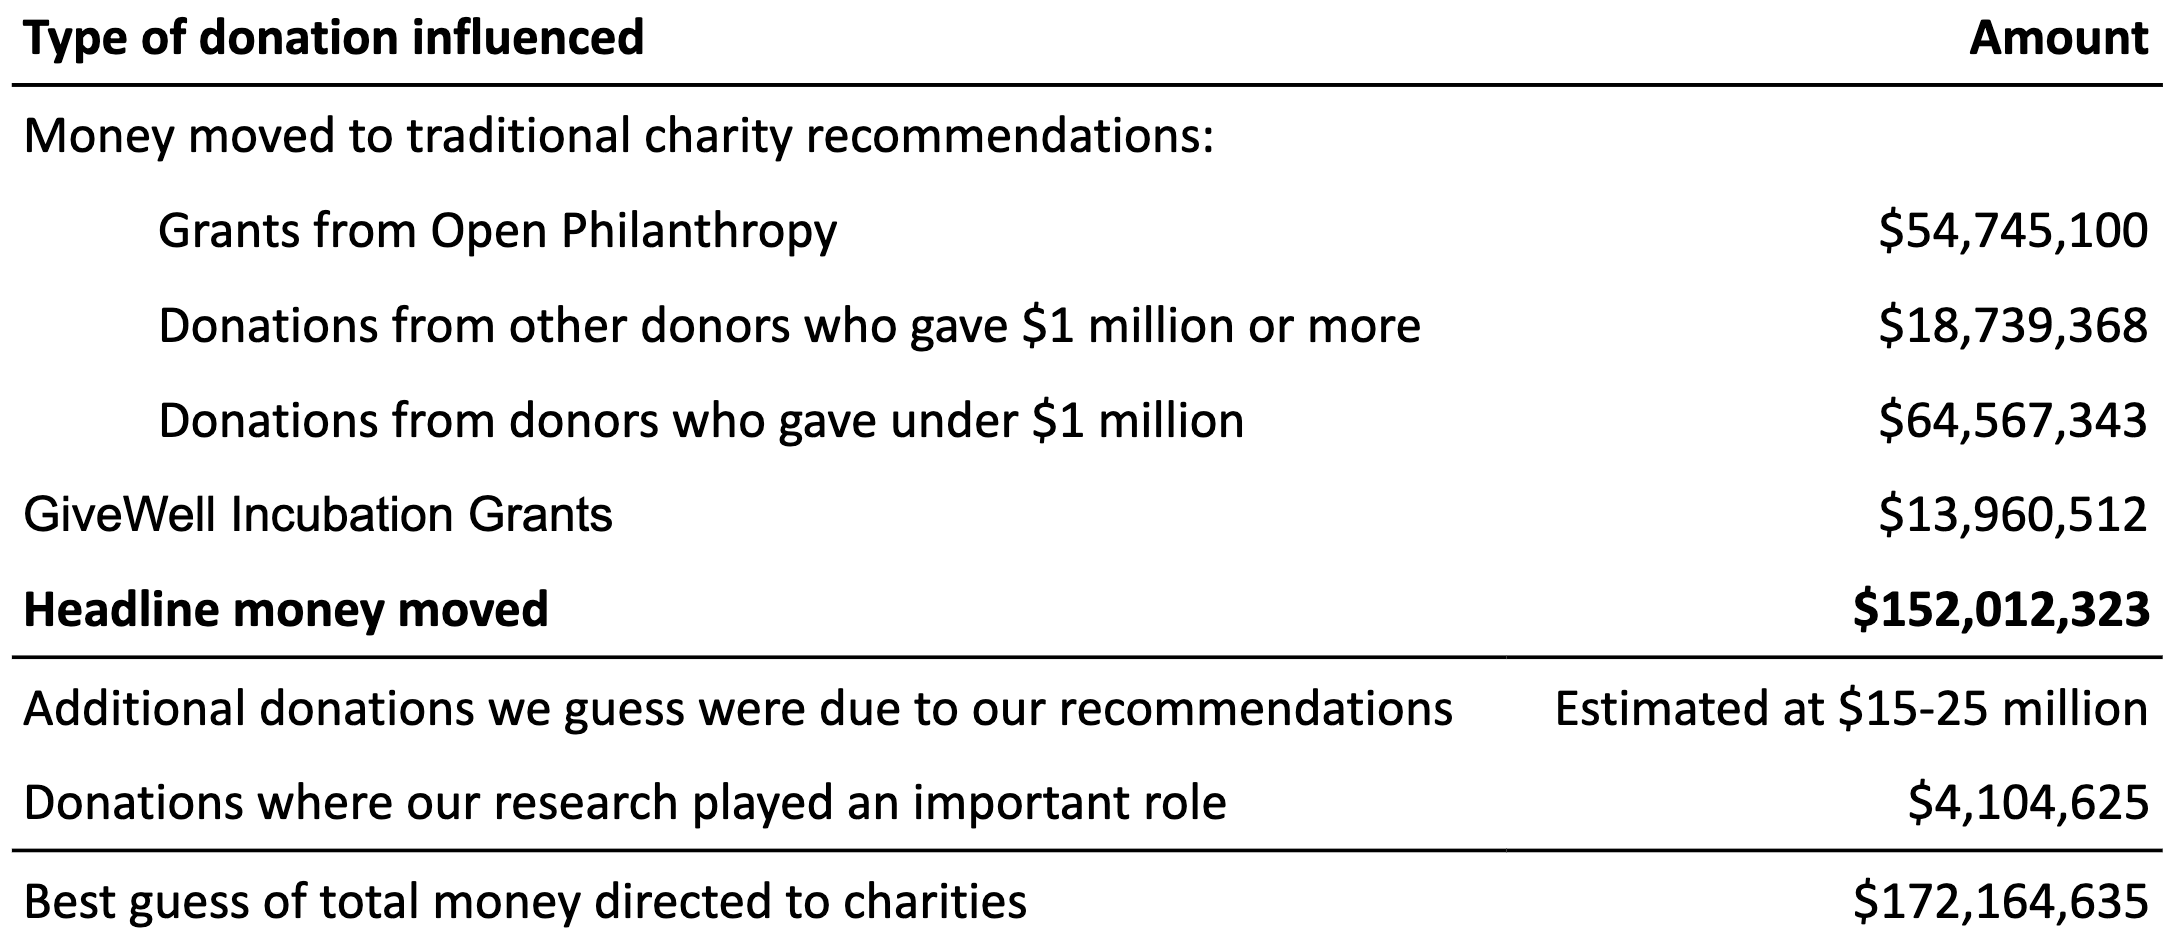
Headline money moved: In 2019, we confidently tracked $152 million in money moved to our top charities, standout charities, and via our GiveWell Incubation Grants program. This amount, which we call “headline money moved,” only counts donations that we are confident were influenced by our recommendations. This includes the grants we make through the Maximum Impact Fund.
We also estimate that we played a significant role in influencing an additional $20 million in donations, but we are unable to attribute these donations directly to GiveWell. Because we are more uncertain about this influence, we do not include this amount in our “headline money moved” figure but include it in our “best guess of total money directed to charities” figure.[4]
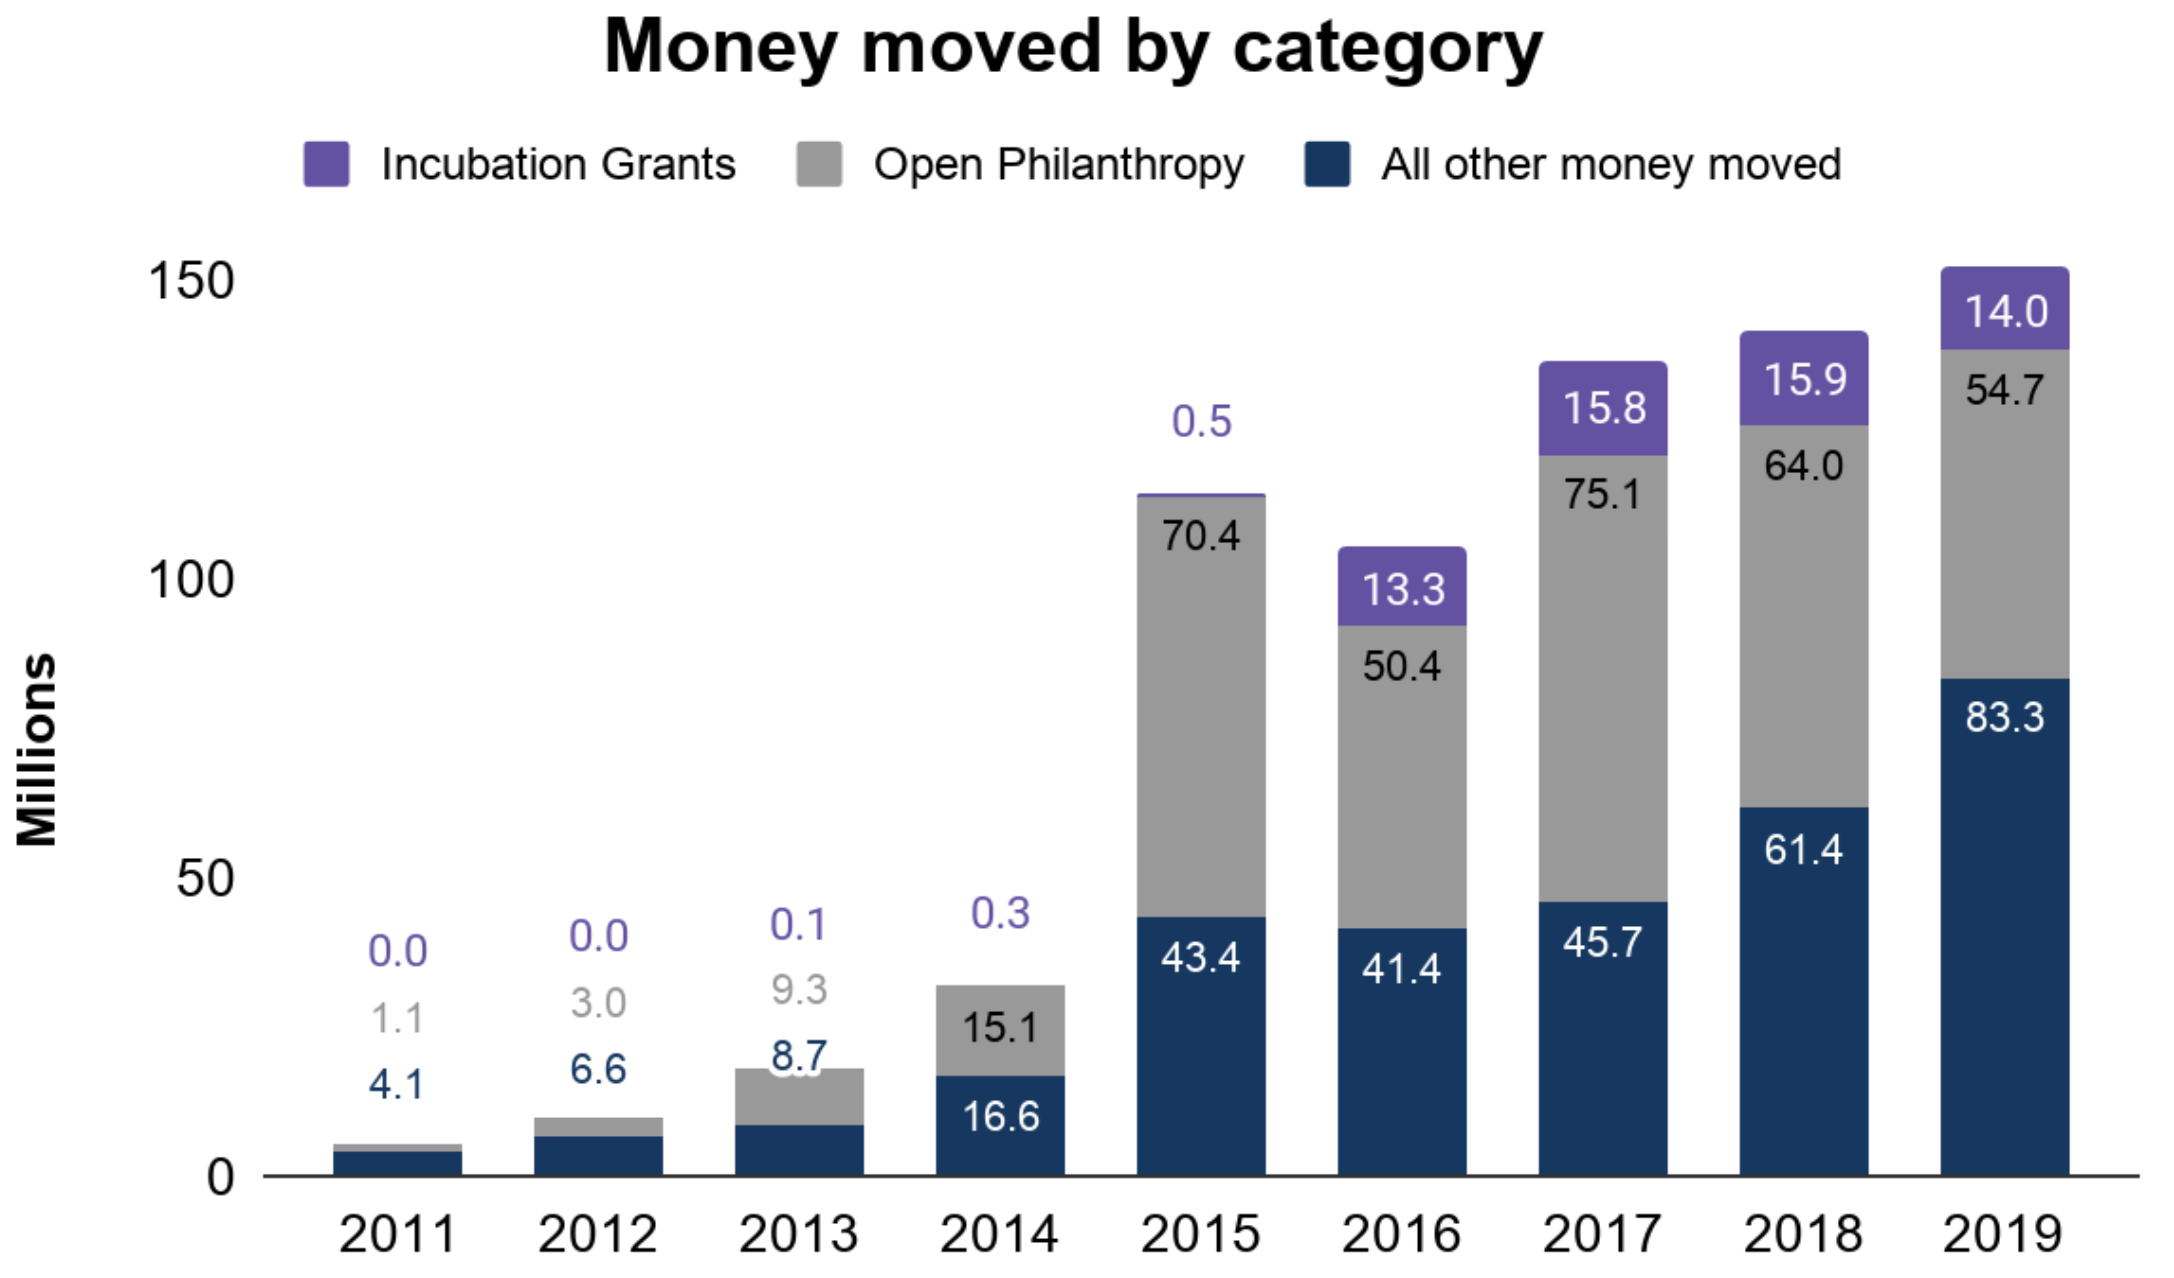
The chart below shows the breakdown of our headline money moved into the following categories: grants that Open Philanthropy made to our recommended charities, donations from other donors to our recommended charities, and Incubation Grants. Please note that Open Philanthropy support (marked in gray) does not include funding it provided for GiveWell Incubation Grants, which are shown separately in purple.
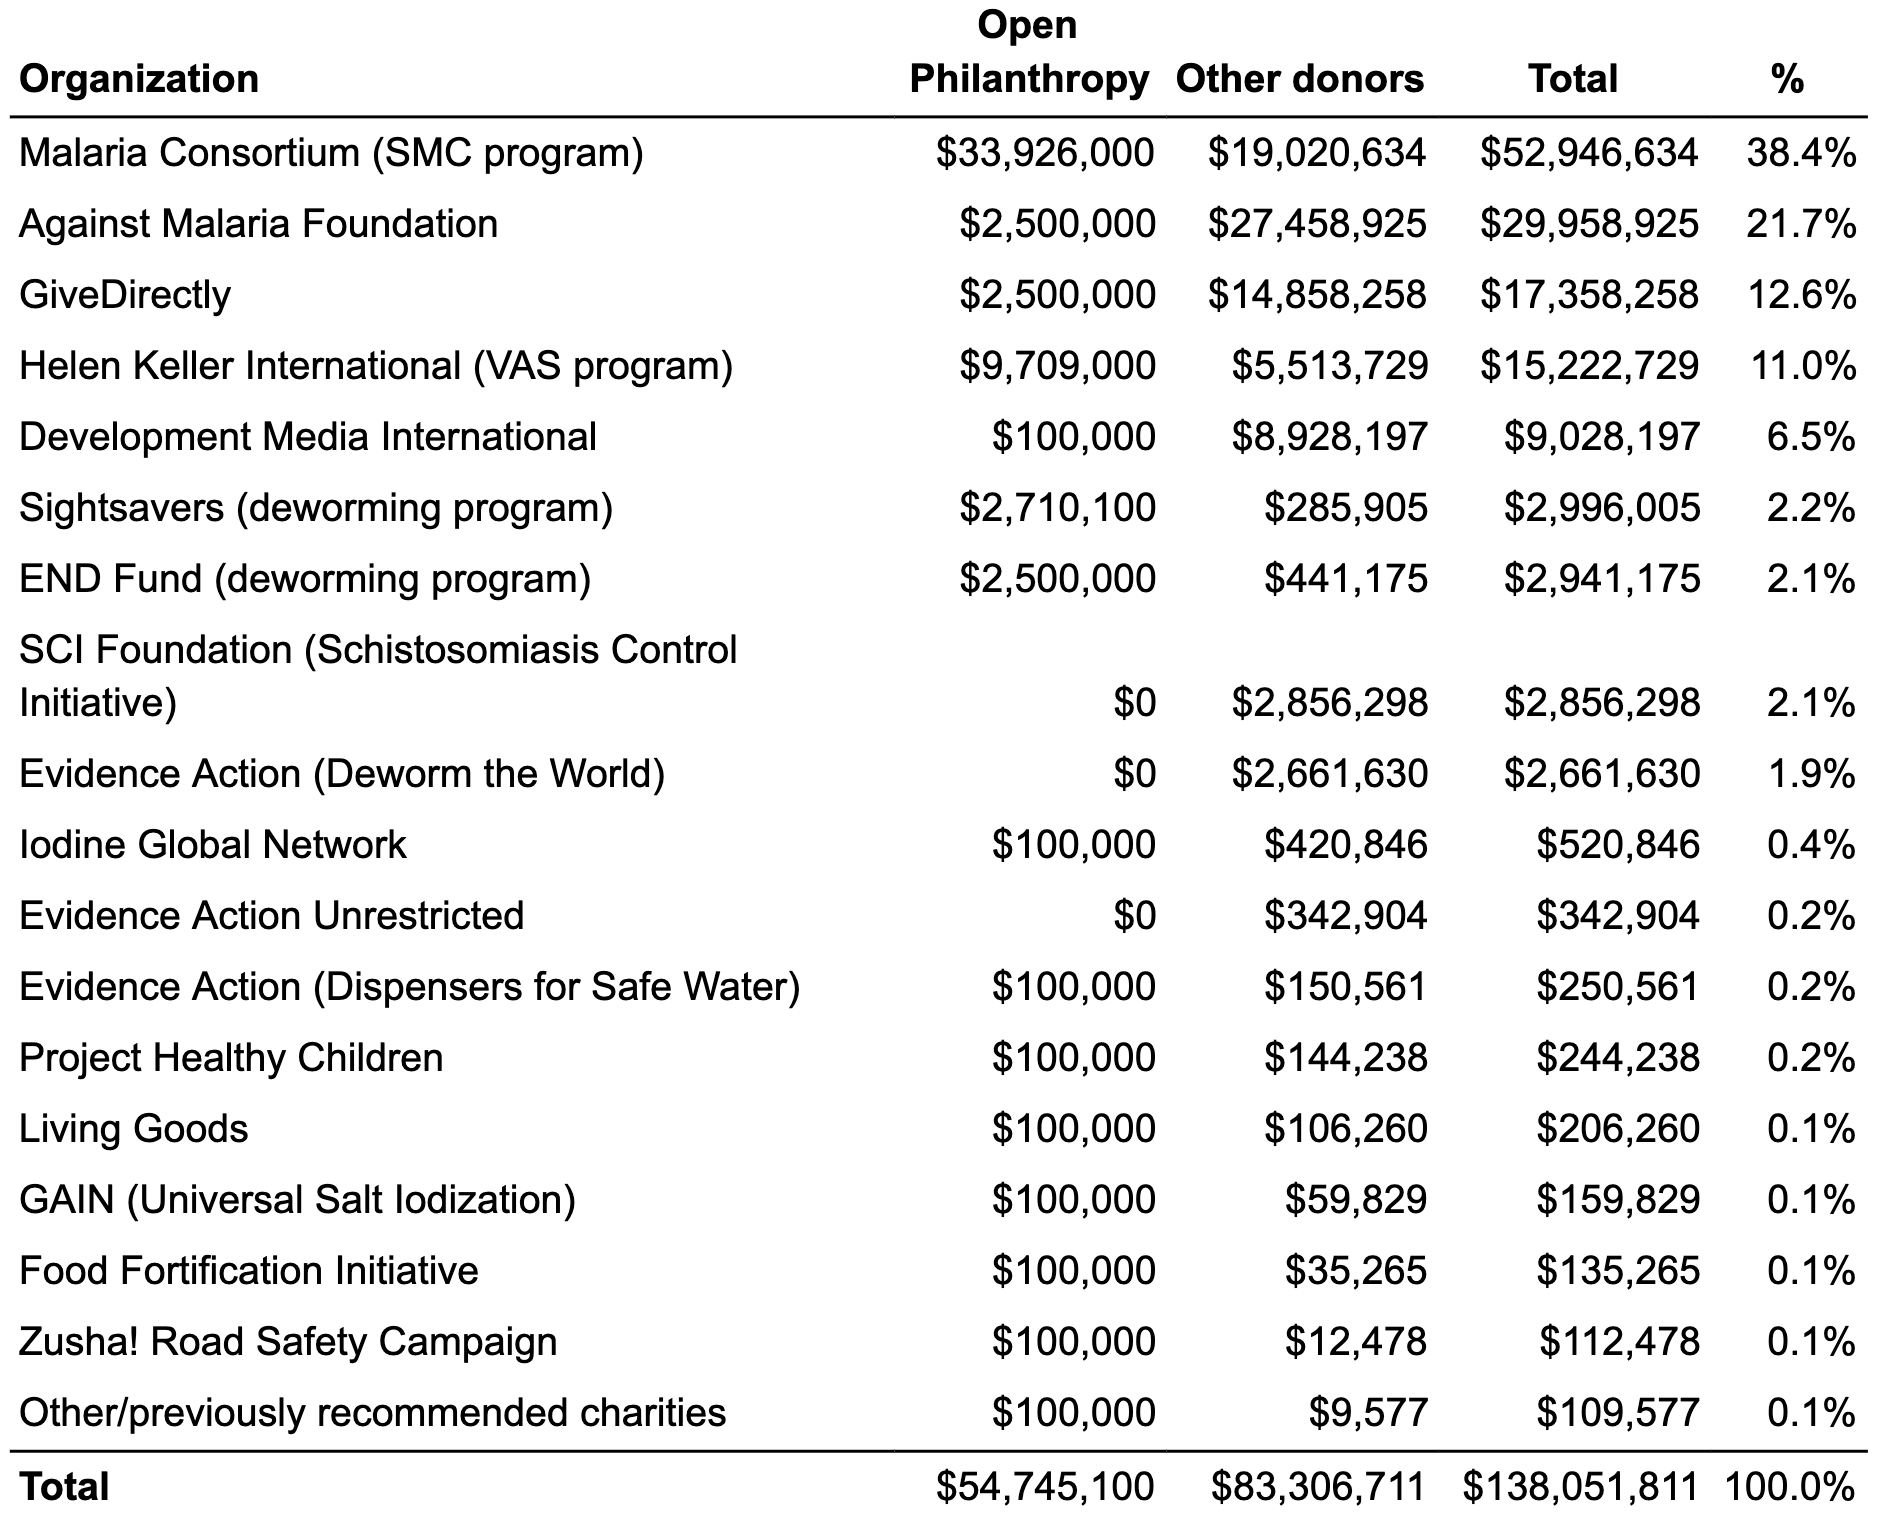
Money moved by charity: Our eight top charities received the majority of our money moved. Our eight standout charities received a total of $10.7 million.
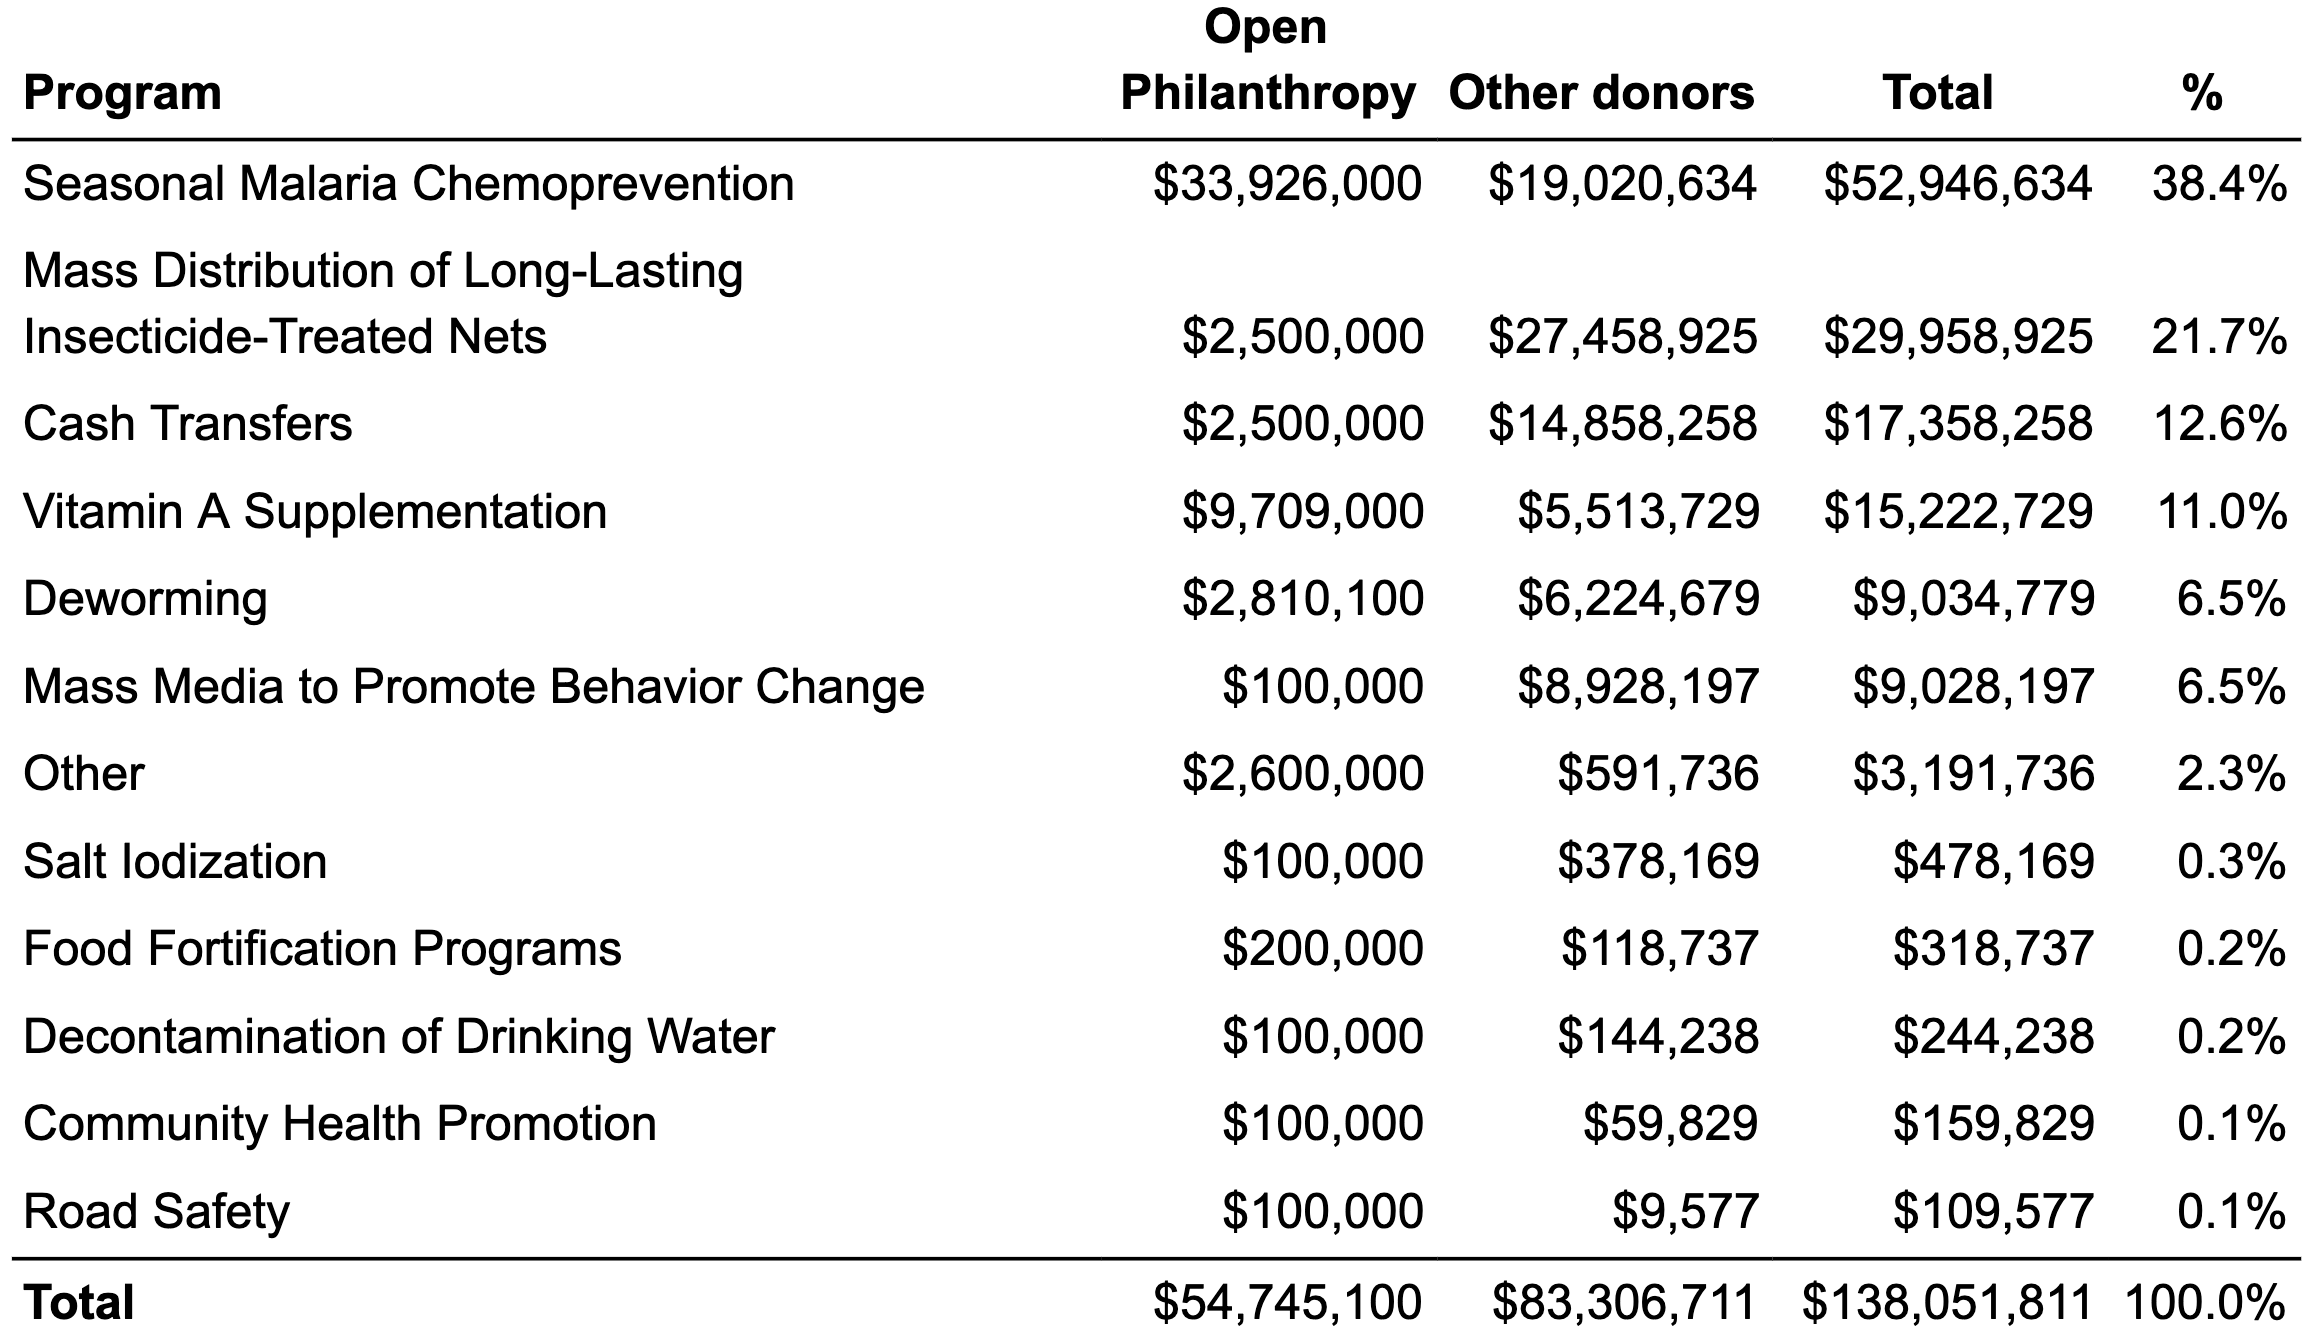
Money moved by program: Our top and standout charities implement a variety of health and poverty alleviation programs. But some of our recommended charities work on the same type of program. For example, we recommend four charities for their programs that support treatments for parasitic worm infections (deworming programs), two charities for their programs to prevent malaria (Malaria Consortium’s seasonal malaria chemoprevention program and the Against Malaria Foundation), and four charities for their food fortification programs. Here, we look at the breakdown of money moved by program type.
The majority of our money moved, including donations to our Maximum Impact Fund, was directed to malaria prevention programs—followed by cash transfers, vitamin A supplementation, deworming, and mass media campaigns. Other programs each received less than 1% of our total money moved.
Money moved by size of donor: We also analyze our money moved by the amount that different donors give, which we categorize into six different “size buckets” (see the chart below, which excludes funding from Open Philanthropy).
A caveat: Our analysis of money moved by donor size is incomplete because we do not have data disaggregated by individual donor for all of the donations we track as money moved—primarily as a result of new European privacy regulations that have led some of our recommended charities to share less-detailed data with us.[5] Among the donations we can attribute to individual donors, the amount of money given increased across all donor size categories compared to 2018. Details are available in the full report.
_2019.png)
_2019.png)
Donations supporting GiveWell’s operations: In expectation of organizational growth, GiveWell raised $17.3 million in unrestricted funding (which we mostly use to support our operations) in 2019, compared to $12.4 million in 2018. The 14 largest individual donors, plus Open Philanthropy, contributed 66% of GiveWell’s operational funding in 2019. GiveWell’s total operating expenses in 2019 were $5.9 million.
We restrict the amount that any one individual or entity can provide to our operations to 20% of our operating budget.
For more detail, see our full metrics report (PDF).
References
Footnotes for this post may be found here.