The GiveWell Blog

How we evaluate a study

We previously wrote about our general principles for assessing evidence, where “evidence” is construed broadly (it may include awards/recognition/reputation, testimony, and broad trends in data as well as formal studies). Here we discuss our approach to a particular kind of evidence, what we call “micro data”: formal studies of the impact of a program on a particular population at a particular time, using quantitative data analysis.

We list several principles that are important to us in deciding how much weight to put on a study’s claims. A future post will discuss the application of these principles to some example studies.

Causal attribution
A study of a charity’s impact will generally highlight a particular positive change in the data – for example, improved school attendance or fewer health problems among children who were dewormed. One of the major challenges of a study is to argue that such a change was caused by the program being studied, as opposed to other factors. Many studies make simple before-or-after comparisons, which may be conflating program effects with other unrelated changes over time (for example, generally improving wealth/education/sanitation/etc.) Many studies make simple participant-to-non-participant comparisons, which can face a significant problem of selection bias: the people who are chosen to participate in a program, or who choose to participate in a program, may be different from non-participants in many ways, so differences may emerge that can’t be attributed to the program.

One way to deal with the problem of causal attribution is via randomization. A randomized controlled trial (in this context) is a study in which a set of people is identified as potential program participants, and then randomly divided into one or more “treatment group(s)” (group(s) participating in the program in question) and a “control group” (a group that experiences no intervention). When this is done, it is generally presumed that any sufficiently large differences that emerge between the treatment and control groups were caused by the program.

Many, including us, consider the randomized controlled trial to be the “gold standard” in terms of causal attribution. However, there are often cases in which randomized controlled trials are politically, financially or practically non-feasible, and there are a variety of other techniques for attributing causality, including:

  • Instrumental variables. An “instrumental variable” is a variable that affects the outcome of interest (for example, income) only through its impact on the intervention/program of interest (for example, access to schooling). An example of such an approach is Duflo 2001, which examines a large-scale government school construction program; it reasons that people who lived in districts that the program reached earlier got better access to education, through a “luck of the draw” that could be thought of as similar to randomization, so any other differences between people who lived in such districts and other people could fairly be attributed to differences in access to education, rather than other differences.We are open to the possibility of a compelling instrumental-variables study, but in practice, it seems that we see very few instrumental variables that are highly plausible as meeting the criteria, and many that seem very questionable. For example, a a paper by McCord, Conley and Sachs uses malaria ecology as an instrument for mortality, implying that the only way malaria ecology could affect the outcome of interest (fertility) is through its impact on mortality. However, Sachs has elsewhere argued that malaria ecology affects people in many ways other than through mortality, and we believe this to be the case.
  • Regression discontinuity. Sometimes there is a relatively arbitrary “cutoff point” for participation in a program, and a study may therefore compare people who “barely qualify” with people who “barely fail to qualify,” along the lines of this study on giving children vouchers to purchase computers. We believe this method to be a relatively strong method of causal attribution, but (a) there tend to be major issues with external validity, since comparing “people who barely qualified with people who barely failed to qualify” may not give results that are representative of the whole population being served; (b) this methodology appears relatively rare when it comes to the topics we focus on.
  • Using a regression to “control for” potential confounding variables. We often see studies that attempt to list possible “confounders” that could serve as alternative explanations for an observed effects, and “control” for each confounder using a regression. For example, a study might look at the relationship between education and later-life income, recognize that this relationship might be misleading because people with more education may have more income to begin with, and therefore examine the relationship between education and income while “controlling for” initial income.We believe that this approach is very rarely successful in creating a plausible case for causality. It is difficult to name all possible confounders and more difficult to measure them; in addition, the idea that such confounders are appropriately “controlled for” usually depends on subtle (and generally unjustified) assumptions about the “shape” of relationships between different variables. Details of our view are beyond the scope of this post, but we recommend Macro Aid Effectiveness Research: A Guide for the Perplexed (authored by David Roodman, whom we have written about before) as a good introduction to the common shortcomings of this sort of analysis.
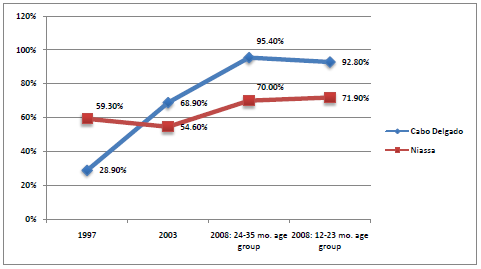
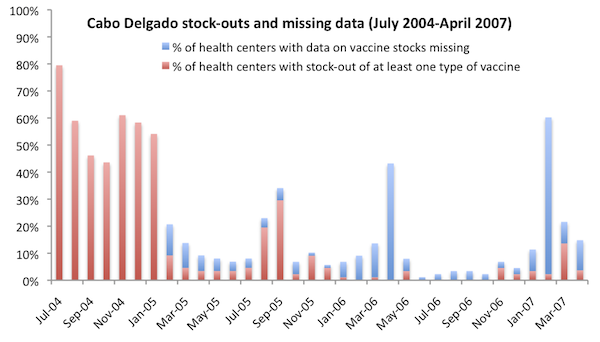
  • Visual and informal reasoning. Researcher sometimes make informal arguments about the causal relationship between two variables, by e.g. using visual illustrations. An example of this: the case for VillageReach includes a chart showing that stock-outs of vaccines fell dramatically during the course of VillageReach’s program. Though no formal techniques were used to isolate the causal impact of VillageReach’s program, we felt at the time of our VillageReach evaluation that there was a relatively strong case in the combination of (a) the highly direct relationship between the “stock-outs” measure and the nature of VillageReach’s intervention (b) the extent and timing of the drop in stockouts, when juxtaposed with the timing of VillageReach’s program. (We have since tempered this conclusion.)We sometimes find this sort of reasoning compelling, and suspect that it may be an under-utilized method of making compelling causal inferences.

Publication bias
We’ve written at length about publication bias, which we define as follows:

“Publication bias” is a broad term for factors that systematically bias final, published results in the direction that the researchers and publishers (consciously or unconsciously) wish them to point.

Interpreting and presenting data usually involves a substantial degree of judgment on the part of the researcher; consciously or unconsciously, a researcher may present data in the most favorable light for his/her point of view. In addition, studies whose final conclusions aren’t what the researcher (or the study funder) hoped for may be less likely to be made public.

Publication bias is a major concern of ours. As non-academics, we aren’t easily able to assess the magnitude and direction of this sort of bias, but we suspect that there are major risks anytime there is a combination of (a) a researcher who has an agenda/”preferred outcome”; (b) a lot of leeway for the researcher to make decisions that aren’t transparent to the reader. We’d guess that both (a) and (b) are very common.

When we evaluate a study, we consider the following factors, all of which bear on the question of how worried we should be that the paper reflects “the conclusions the researcher wanted to find” rather than “the conclusions that the data, impartially examined, points to”:

  • What are the likely motivations and hopes of the authors? If a study is commissioned/funded by a charity, the researcher is probably looking for an interpretation that reflects well on the charity. If a study is published in an academic journal, the researcher is likely looking for an interpretation that could be considered “interesting” – which usually means finding “some effect” rather than “no effect” for a given intervention, though there are potential exceptions (for example, it seems to us that the relatively recent studies of microfinance would have been considered “interesting” whether they found strong effects or no effects, since the impacts of microfinance are widely debated).
  • Is the paper written in a neutral tone? Do the authors note possible alternate interpretations of the data and possible objections to their conclusions? When we saw a white paper commissioned by the Grameen Foundation (at the time, the most comprehensive review of the literature on microfinance we could find) making statements like “Unfortunately, rather than ending the debate over the effectiveness of microfinance, Pitt and Khandker’s paper merely fueled the fire” and “The previous section leaves little doubt that microfinance can be an effective tool to reduce poverty” (a statement that didn’t seem true to us), we questioned the intentions of the author, and were more inclined to be pessimistic where details were scarce. In general, we expect a high-quality paper to proactively identify counterarguments and limitations to its findings.
  • Is the study preregistered? Does it provide a link to the full details of its analysis, including raw data and code? As we have previously written, preregistration and data/code sharing are two important tools that can alleviate concerns around publication bias (by making it harder for questionable analysis decisions to go unnoticed).It seems to us that these practices are relatively rare in the field of economics, and less rare in the field of medicine.
  • How many outcomes does the study examine, and which outcomes does it emphasize in its summary? We often see studies that look for an intervention’s effect on a wide range of outcomes, find significant effects only on a few, and emphasize these few without acknowledging (or quantitatively analyzing) the fact that focusing on the “biggest measured effect size” is likely to overstate the true effect size. Preregistration (see above) would alleviate this issue by allowing researchers to credibly claim that the outcome they emphasize was the one they had intended to emphasize all along (or, if it wasn’t, to acknowledge as much). However, even if a study isn’t preregistered, it can acknowledge the issue and attempt to adjust for it quantitatively; studies frequently do not do so.
  • Is the study expensive? Were its data collected to answer a particular question? If a lot of money and attention is put into a study, it may be harder for the study to fall prey to one form of publication bias: the file drawer problem. Most of the field studies we come across involve collecting data on developing-world populations over a period of years, which is fairly expensive, for the purpose of answering a particular question; by contrast, studies that consist simply of analyzing already-publicly-available data, or of experiments that can be conducted in the course of a day (as with many psychology studies), seem to us to be more susceptible to the file-drawer problem.

Other considerations

  • Effect size and p-values. A study will usually report the “effect size” – the size of the effect it is reporting for the program/treatment – in some form, along with a p-value that expresses, roughly speaking, how likely it is that an effect size at least as big as the reported effect size would have been observed, by chance, if the treatment fundamentally had no effect.We find the effect size useful for obvious reasons – it tells us how much difference the program is reported to have made, and we can then put this in context with what we’ve seen of similar programs to gauge plausibility. We find the p-value (and, related, reports of which effects are “statistically significant” – which, in the social sciences, generally means a p-value under 5%) useful for a couple of reasons:
    • Even a very large observed effect (if observed in a relatively small sample) could simply be random variation. We generally emphasize effects with p-values under 5%, which is a rough and common proxy for “unlikely to be random variation.”
    • The p-value tends to be considered important within academia: researchers generally emphasize the findings with p-values under a certain threshold (which varies by field). We would guess that most researchers, in designing their studies, seek to find a sample size high enough that they’ll get a sufficiently low p-value if they observe an effect as large as they hope/expect. Therefore, asking “is the p-value under the commonly accepted threshold?” can be considered a rough way of asking “Did the study find an effect as large as what the researcher hoped/expected to find?”


  • Sample size and attrition. “Sample size” refers to the number of observations in the study, both in terms of how many individuals were involved and how many “clusters” (villages, schools, etc.) were involved. “Attrition” refers to how many of the people originally included in the study were successfully tracked for reporting final outcomes.In general, we put more weight on a study when it has greater sample size and less attrition. In theory, the reported “confidence interval” around an effect size should capture what’s important about the sample size (larger sample sizes will generally lead to narrower confidence intervals, i.e., more precise estimates of effect size). But (a) we aren’t always confident that confidence intervals are calculated appropriately, especially in nonrandomized studies; (b) large sample size can be taken as a sign that a study was relatively expensive and prominent, which bears on “publication bias” as discussed above; (c) more generally, we intuitively see a big difference between a statistically significant impact from a study that randomized treatment between 72 clusters including a total of ~1 million individuals (as an unpublished study on the impact of vitamin A did) and a statistically significant impact from a study that included only 111 children (as the Abecedarian Project did), or a study that compared two villages receiving a nutrition intervention to two villages that did not (as with a frequently cited study on the long-term impact of childhood nutrition).
  • Effects of being studied? We think it’s possible that in some cases, the mere knowledge that one has been put into the “treatment group,” receiving a treatment that is supposed to improve one’s life, could be partly or fully responsible for an observed effect. One mechanism for this issue would be the well-known “placebo effect.” Another is the possibility that people might actively try to get themselves included in the treatment group, leading to a dynamic in which the most motivated or connected people become overrepresented in the treatment group.The ideal study is “double-blind”: neither the experimenters nor the subjects know which people are being treated and which aren’t. “Double-blind” studies aren’t always possible; when a study isn’t blinded, we note this, and ask how intuitively plausible it seems that the outcomes observed could have been due to the lack of blinding.
  • External validity. Most of the points above emphasize “internal validity”: the validity of the study’s claim a certain effect occurred in the particular time and place that the study was carried out in. However, even if the study’s claims about what happened are fully valid, there is the additional question: “how will the effects seen in this study translate in other settings and larger-scale programs?”We’d guess that the programs taking place in studies are often unusually high-quality, in terms of personnel, execution, etc. (For example, see our discussion of studies on insecticide-treated nets: the formal studies of net distribution programs involved a level of promoting usage that large-scale campaigns do not and cannot include.) In addition, we often note something about a study that indicates that it took place under unusual conditions (for example, a prominent study of deworming took place while El Nino was bringing worm infections to unusually high levels).

A note on randomized controlled trials (RCTs)
The merits of randomized controlled trials (RCTs) have been debated, and in particular the question has arisen of whether the RCT should be considered the “gold standard.”

We believe that RCTs have multiple qualities that make them – all else equal – more credible than other studies. In addition to their advantages for causal attribution, RCTs tend to be relatively expensive and to be clearly aimed at answering a particular question, which has advantages regarding publication bias. In today’s social sciences environment – in which preregistration is rare – we think that the property of being an RCT is probably the single most encouraging (easily observed) property a study can have, which has a practical implication: we often conduct surveys of research by focusing/starting on finding RCTs (while also trying to include the strongest and most prominent non-RCTs).

That said, the above discussion hopefully makes it clear that we ask a lot of questions about a study besides whether it is an RCT. There are nonrandomized studies we find compelling as well as randomized studies we don’t find compelling. And we think it’s possible that if preregistration were more common, we’d consider preregistration to be a more important and encouraging property of a study than randomization.

Our principles for assessing evidence

For several years now we’ve been writing up our thoughts on the evidence behind particular charities and programs, but we haven’t written a great deal about the general principles we follow in distinguishing between strong and weak evidence. This post will

  • Lay out the general properties that we think make for strong evidence: relevant reported effects, attribution, representativeness, and consonance with other observations. (More)
  • Discuss how these properties apply to several common kinds of evidence: anecdotes, awards/recognition/reputation, “micro” data and “macro” data. (More)

This post focuses on broad principles that we apply to all kinds of “evidence,” not just studies. A future post will go into more detail on “micro” evidence (i.e., studies of particular programs in particular contexts), since this is the type of evidence that has generally been most prominent in our discussions.

General properties that we think make for strong evidence
We look for outstanding opportunities to accomplish good, and accordingly, we generally end up evaluating charities that make (or imply) relatively strong claims about the impact of their activities on the world. We think it’s appropriate to approach such claims with a skeptical prior and thus to require evidence in order to put weight on them. By “evidence,” we generally mean observations that are more easily reconciled with the charity’s claims about the world and its impact than with our skeptical default/”prior” assumption.

To us, the crucial properties of such evidence are:

  • Relevant reported effects. Reported effects should be plausible as outcomes of the charity’s activities and consistent with the theory of change the charity is presenting; they should also ideally get to the heart of the charity’s case for impact (for example, a charity focused on economic empowerment should show that it is raising incomes and/or living standards, not just e.g. that it is carrying out agricultural training).
  • Attribution. Broadly speaking, the observations submitted as evidence should be easier to reconcile with the charity’s claims about the world than with other possible explanations. If a charity simply reports that its clients have higher incomes/living standards than non-participants, this could be attributed to selection bias (perhaps higher incomes cause people to be more likely to participate in the charity’s program, rather than the charity’s program causing higher incomes), or to data collection issues (perhaps clients are telling surveyors what they believe the surveyors want to hear), or to a variety of other factors.The randomized controlled trial is seen by many – including us – as a leading method (though not the only one) for establishing strong attribution. By randomly dividing a group of people into “treatment” (people who participate in a program) and “control” (people who don’t), a researcher can make a strong claim that any differences that emerge between the two groups can be attributed to the program.
  • Representativeness. We ask, “Would we expect the activities enabled by additional donations to have similar results to the activities that the evidence in question applies to?” In order to answer this well, it’s important to have a sense of a charity’s room for more funding; it’s also important to be cognizant of issues like publication bias and ask whether the cases we’re reviewing are likely to be “cherry-picked.”
  • Consonance with other observations. We don’t take studies in isolation: we ask about the extent to which their results are credible in light of everything else we know. This includes asking questions like “Why isn’t this intervention better known if its effects are as good as claimed?”

Common kinds of evidence

  • Anecdotes and stories – often of individuals directly affected by charities’ activities – are the most common kind of evidence provided by charities we examine. We put essentially no weight on these, because (a) we believe the individuals’ stories could be exaggerated and misrepresented (either by the individuals, seeking to tell charity representatives what they want to hear and print, or by the charity representatives responsible for editing and translating individuals’ stories); (b) we believe the stories are likely “cherry-picked” by charity representatives and thus not representative. Note that we have written in the past that we would be open to taking individual stories as evidence, if our “representativeness” concerns were addressed more effectively.
  • Awards, recognition, reputation. We feel that one should be cautious and highly context-sensitive in deciding how much weight to place on a charity’s awards, endorsements, reputation, etc. We have long been concerned that the nonprofit world rewards good stories, charismatic leaders, and strong performance on raising money (all of which are relatively easy to assess) rather than rewarding positive impact on the world (which is much harder to assess). We also suspect that in many cases, a small number of endorsements can quickly snowball into a large number, because many in the nonprofit world (having little else with which to assess a charity’s impact) decide their own endorsements more or less exclusively on the basis of others’ endorsements. Because of these issues, we think this sort of evidence often is relatively weak on the criteria of “relevant reported effects” and “attribution.”We certainly feel that a strong reputation or referral is a good sign, and provides reason to prioritize investigating a charity; furthermore, there are particular contexts in which a strong reputation can be highly meaningful (for example, a hospital that is commonly visited by health professionals and has a strong reputation probably provides quality care, since it would be hard to maintain such a reputation if it did not). That said, we think it is often very important to try to uncover the basis for a charity’s reputation, and not simply rely on the reputation itself.
  • Testimony. We see value in interviewing people who are well-placed to understand how a particular change took place, and we have been making this sort of evidence a larger part of our process (for example, see our reassessment of VillageReach’s pilot project). When assessing this sort of evidence, we feel it is important to assess what the person in question is and isn’t well-positioned to know, and whether they have incentive to paint one sort of picture or another. How the person was chosen is another factor: we generally place more weight on the testimony of people we’ve sought out (using our own search process) than on the testimony of people we’ve been connected to by a charity looking to paint a particular picture.
  • “Micro” data. We often come across studies that attempt to use systematically collected data to argue that, e.g., a particular program improved people’s lives in a particular case. The strength of this sort of evidence is that researchers often put great care into the question of “attribution,” trying to establish that the observed effects are due to the program in question and not to something else. (“Attribution” is a frequent weakness of the other kinds of evidence listed here.) The strength of the case for attribution varies significantly, and we’ll discuss this in a future post.When examining “micro” data, we often have concerns around representativeness (is the case examined in a particular study representative of a charity’s future activities?) and around the question of relevant reported outcomes (these sorts of studies often need to quantify things that are difficult to quantify, such as standard of living, and as a result they often use data that may not capture the full reality of what happened).
  • “Macro” data. Some of the evidence we find most impressive is empirical analysis of broad (e.g., country-level) trends. While this sort of evidence is often weaker on the “attribution” front than “micro” data, it is often stronger on the “representativeness” front. (More.)

In general, we think the strongest cases use multiple forms of evidence, some addressing the weaknesses of others. For example, immunization campaigns are associated with both strong “micro” evidence (which shows that intensive, well-executed immunization programs can save lives) and “macro” evidence (which shows, less rigorously, that real-world immunization programs have led to drops in infant mortality and the elimination of various diseases).

Quick update: New way to follow GiveWell’s research progress

There are two types of materials we publish periodically throughout the year:

  • We frequently speak with charity representatives or other subject matter experts. We ask permission to take notes during these conversations so that we can publish them to our conversations page.
  • We publish new charity review or intervention report pages.

We’ve set up a Google Group so that those who want can get updated when we publish new material.

You can subscribe to this via RSS using this RSS feed. You can also sign up to receive updates via email at the group’s home page.

Revisiting the 2011 Japan disaster relief effort

Last year, Japan was hit by a severe earthquake and tsunami, and we recommended giving to Doctors Without Borders specifically because it was not soliciting funds for Japan. We reasoned that the relief effort did not appear to have room for more funding – i.e., we believed that additional funding would not lead to a better emergency relief effort. We made our case based on factors including the lack of an official appeal on ReliefWeb, reports from the U.N. Office for the Coordination of Humanitarian Affairs, statements by the Japanese Red Cross, the behavior of major funders including the U.S. government, and the language used by charities in describing their activities. We acknowledged that donations may have beneficial humanitarian impact in Japan, as donations could have beneficial humanitarian impact anywhere, but felt that the nature of the impact was likely to fall under what we characterized as “restitution” and “everyday aid” activities, as opposed to “relief” or “recovery” activities.

Since it’s now been over a year since the disaster, we made an effort to find one-year reports from relevant organizations and get a sense of how donations have been spent.

We have published a detailed and sourced set of notes on what reports we could find and what they revealed about activities. Our takeaways:

  • Very little information on expenditures was provided. Out of 11 organizations we examined, there were only 6 that prominently reported (such that we could find it) the total amount raised or spent for Japan disaster relief. Out of these, only Save the Children, the American Red Cross, and the Japanese Red Cross provided any breakdown of spending by category. Breakdowns provided by Save the Children and American Red Cross were very broad, with 5 and 3 categories respectively; the Japanese Red Cross provided more detail.
  • The Japanese Red Cross spent most of the funds it received on two categories of expense: (1) cash transfers and (2) electrical appliances for those affected. It reports the equivalent of ~$4.2 billion in cash grants. Out of its ~$676 million budget for recovery activities, 49% was spent specifically on “sets of six electronic household appliances … distributed to 18,840 households in Iwate, 48,638 in Miyagi, 61,464 in Fukushima and 1,820 in other prefectures.” (This quote was the extent of the information provided on this activity.) The Japanese Red Cross also spent significant funds on reconstruction/rehabilitation of health centers and services and pneumonia vaccinations for the elderly.

    A relatively small amount of funding (the equivalent of ~$5.6 million) is reported for activities that the Japanese Red Cross puts under its “emergency” categories in its budget. (These include distribution of supplies, medical services, and psychosocial counseling). It is possible that there was a separate budget for emergency relief that is not included in the report.

    Note that the Japanese Red Cross raised and spent substantially more money than the other nonprofits we’ve listed, and also gave substantially more detail on its activities and expenses.

  • Other nonprofits reported a mix of traditional “relief” activities, cash-transfer-type activities, and entertainment/recreation-related activities. Of the groups that provide some concrete description of their activities (not all did), all reported engaging in distribution of basic supplies and/or provision of psychosocial counseling. Most reported some cash-transfer-type activities: cash-for-work; scholarships; grants to community organizations; support for fisheries, including re-branding efforts and provision of fishing vessels. And most reported some entertainment/recreation activities: festivals, performing arts groups, community-building activities, sporting equipment and sports programs for youth, weekend and summer camps. None reported only traditional “relief” activities. (We concede that all of these activities may have had substantial humanitarian impact, and that some may have been complementary to more traditional “relief” activities; however, we think it is important to note these distinctions, for reasons discussed below.)
  • Currently, Oxfam’s page on the Japan disaster states, “Oxfam has been ready to assist further but is not launching a major humanitarian response at this time. We usually focus our resources on communities where governments have been unable – or, in some cases, unwilling – to provide for their people. But the Japanese government has a tremendous capacity for responding in crises, and a clear commitment to using its resources to the fullest.” Note that on the day of the disaster, Oxfam featured a solicitation for this disaster on its front page.

Based on our earlier conclusion that the relief effort did not have “room for more funding,” we expected to find (a) reports of the sort of activities that nonprofits could spend money on in non-disaster-relief settings (including cash-transfer-type programs, giving out either cash itself or items that could easily be resold, which could likely be carried out in any setting without objections); (b) reports that were relatively light on details and financial breakdowns. We observed both of these things in the reports discussed above, in nearly every case. In isolation, nothing about the above-described activities rules out the idea that nonprofits were carrying out important, beneficial activities that were core to recovery; but when combined with our earlier evidence of no “room for more funding,” we feel that the overall picture is consistent.

We were somewhat surprised to see the degree to which many nonprofits funded entertainment/recreation activities; these sort of activities aren’t what we think of as the core competency of international NGOs working mostly in the developing world, and we continue to feel that in a situation such as Japan’s, direct unconditional cash transfers make more sense than activities such as these. (This is a point in favor of the Japanese Red Cross, which – unlike other nonprofits – reported significant spending on cash transfers.)

We therefore stand by the conclusions we reached last year: that the relief and recovery effort did not have room for more funding, that those interested in emergency relief should have donated to Doctors Without Borders, and that those determined to help Japan specifically should have donated to the Japanese Red Cross.

Recent conversation with Bill Easterly

We recently sat down for a conversation with Bill Easterly, on the subject of how to improve the value-added of academic research. Prof. Easterly posted highlights from our public notes from the conversation; we thought we’d share our thoughts on his views.

Points of agreement: we believe we agree with Prof. Easterly on many core points.

  • We are generally highly skeptical of “top-down” interventions. We believe such interventions have many more ways to fail than to succeed, and we generally find “evidence of effectiveness” to have more holes in it and to be less convincing than others find it to be.
  • We agree that, all else equal, “Markets and democracy are better feedback mechanisms than RCTs [randomized controlled trials].” We believe there are cases where markets and democracy fail and aid can provide help that they can’t, and would guess that Prof. Easterly agrees on this as well.
  • We agree that what Prof. Easterly calls “dissidents” play a positive and valuable role.

Points of possible disagreement.

  • We don’t believe in a “first, do no harm” rule for aid. Instead, we try to maximize “expected good accomplished.” It is easy to overestimate benefits and underestimate possible harms, and we try to be highly attentive to this issue, but we believe that it isn’t practical to eliminate all risks of doing harm, and putting too high a priority on “avoiding harm” would cause aid to do less good overall.
  • Prof. Easterly observes, “a lot of things that people think will benefit poor people… {are things} that poor people are unwilling to buy for even a few pennies … The philosophy behind this is that poor people are irrational. That could be the right answer, but I think that we should do more research on the topic.” We have some sympathy with this view and agree that more evidence would be welcome, but we are probably less hesitant than Prof. Easterly is to conclude that people simply undervalue things like insecticide-treated nets. Brett Keller observes that irrationality about one’s health is common in the developed world. In the developing world, there are substantial additional obstacles to properly valuing medical interventions such as lack of the education and access necessary to even review the evidence. The effects of something like bednets (estimated at one child death averted for every ~200 children protected) aren’t necessarily easy for recipients to notice or quantify.We’ve previously published some additional reasons to provide proven health interventions rather than taking households’ choices as the final word on what’s best for them.
  • We believe that empowering locals to choose their own aid is much harder in practice than it may sound – and that the best way to achieve the underlying goal may well be to deliver proven health interventions. We’ve argued this point previously.

Bottom line: much of our differing viewpoints may be attributed to differences in how we see our roles. Prof. Easterly appears to see himself as a “dissident”; his role is to challenge the way things are done without recommending a particular course of action. We see ourselves as advisors to donors, helping them to give as well as possible today. So while we share many of Prof. Easterly’s concerns – and would be highly open to new approaches to addressing these concerns – we’re also in the mindset of moving forward based on the best evidence and arguments available at the moment. In our view, this currently means recommending our top charities. However, someone who puts more weight on Prof. Easterly’s concerns may consider donating to GiveDirectly instead, which is aiming to avoid prescriptive aid by giving cash.

GiveWell’s issues log: VillageReach analysis

Recently, we’ve been reflecting on and evaluating our past analysis of VillageReach. We’ve undertaken this analysis and published what we’ve learned because we feel that our process performed suboptimally, and careful consideration of what caused this may lead to improvement on our part.

Broadly, we categorize the problems below as “questions we could have asked to dig even deeper into VillageReach and its program.” The root cause of our failure to ask these questions came down to less context on international aid and a less thorough process than we have now. At the time we conducted most of our VillageReach analysis (2009 and 2010), we felt that our due diligence was sufficient – especially in light of many others (funders and charities) who told us that we were already digging deep enough and that our process was more intense than others they had seen. Today, we feel that a more thorough process is important. We feel that our research process has since advanced to a stage where we would effectively deal with each of the below issues in the course of our research process.

We were not sufficiently sensitive to the possibility that non-VillageReach factors might have led to the rise in immunization rates in Cabo Delgado; this caused us to overestimate the strength of the evidence for VillageReach’s impact

This issue is the main topic of the blog post we recently published on this topic, which describes what occurred in greater detail.

A key part of this issue was our analysis of the chart below, which compares changes in immunization rates in Niassa (where VillageReach did not work) to Cabo Delgado (where it did).

VillageReach’s evaluation presents the larger rise in Cabo Delgado relative to Niassa as suggestive evidence of VillageReach’s impact. We felt that the comparison provided limited evidence of impact. However, we did not ask (or if we asked, we have no record of asking or of VillageReach’s response) VillageReach about why Niassa experienced a large rise in immunization rates during the period of VillageReach’s pilot project. VillageReach was not active in Niassa at the time, and the fact that Niassa experienced a large increase in immunization coverage should have caused us to question whether VillageReach’s program, as opposed to other factors, caused the increase.

Over the last couple of years, we have had multiple experiences (some on the record, some off) with what we now call the “government interest confounder”: a quick and encouraging improvement on some metric coincides with a nonprofit’s entry into an area, but further analysis reveals that both could easily have been a product of the government’s increased interest in the issue the nonprofit works on. We are now keenly aware of this issue and always seek to understand what activities the government was undertaking at the time in question (something we previously were unable to do due to our greater difficulty getting access to the right people).

Note that we are not saying that the improvement in immunization coverage was due to government activities; we still find it possible that VillageReach was primarily responsible for the improvements. But we do find the case for the latter to be less conclusive than we thought it was previously.

We did not ask VillageReach for the raw data associated with the stockouts chart.

In our July 2009 VillageReach review, we copied a chart showing a fall in stockout rates from VillageReach’s evaluation of its pilot project into our review. (See chart here.)

In September 2011, we asked VillageReach for the raw data that they used to create the chart to further vet the accuracy of the data. Using the raw data, we recreated their chart, which matched the copied chart reasonably well. (See chart here.)

In our review of the raw data, we noticed that, in addition to data on stockouts, there was also data for “clinics with missing data.” Because missing data plausibly reflect “clinics with stockouts” (more discussion of this issue here), we created a second chart (which follows) that showed both stockouts and missing data.

This chart presents a more complete picture of VillageReach’s success reducing stockout levels of vaccines at the clinics it served. During 2006, the year in which VillageReach reduced stockouts to near-zero levels, nearly half the year had significant levels of missing data. Having and reviewing all data in 2009 might have led us to ask additional questions such as: “Given that there’s evidence that VillageReach only succeeded in reducing stockouts to extremely low levels for a total of 6 months, how likely is it that it will be able to successfully scale its model to (a) new provinces while (b) using a less hands-on approach to implementing its program?”

We didn’t previously have a habit of asking for raw data behind key charts, but we have learned to do so after incidents such as our uncovering of major errors in an official cost-effectiveness estimate for deworming.

Ultimately, we felt that this particular chart held up fairly well under the raw-data-based examination. We still think it provides good evidence that VillageReach made a difference in this case. But it is a less strong case than we previously perceived it to be, and if we had been in the habit of asking for raw data we would have seen this earlier.

We misinterpreted data on immunization rates in Cabo Delgado following the end of VillageReach’s pilot project.

VillageReach’s baseline coverage study for Cabo Delgado stated, “There has been a reduction in vaccine coverage from 2008 to 2010 (children below 12 months of age) of nearly 18 percentage points” (VillageReach, “Vaccination Coverage Baseline Survey for Cabo Delgado Province,” Pg 31). We echoed this claim in March 2011, as part of our first VillageReach update (we wrote, “Overall immunization has fallen only slightly since the 2008 conclusion of VillageReach’s work in this province, but it has fallen significantly for children under the age of 12 months.”) Since then, we have concluded that we misinterpreted this data: while the percentage of children who were “fully immunized” fell between 2008 and 2010, other indicators of vaccine coverage (e.g., “fully vaccinated” and “DTP3” coverage) did not similarly fall.

We realized our error in early 2012 as we were working on further VillageReach updates (and we published the fact that we had erred in our latest update). This error occurred because we relied on the quote in VillageReach’s report (above) without fully tracing back the source data and recognizing the importance of the different vaccine indicators. On the other hand, other data has since become available that is consistent with our original reading (details in our previous post on the subject).

In a December 2009 blog post, we wrote that immunization rates had fallen after VillageReach’s project ended; instead, we should have written that stockout rates rose after VillageReach’s project ended.

In a blog post published on December 30, 2009, we wrote,

The fact that vaccination rates have since fallen is further evidence that VillageReach made a difference while they were there, but obviously discouraging relative to what they had hoped for.

This case was simply an error. Both Holden and I review each post before we publish it. In this case, Holden wrote it; I approved it; and the error got through.

I believe we knew at the time that we had no information about changes in immunization rates, only data on changes in stockout rates. Thus, I think this quote represents a small “communication error” rather than a large “error in understanding.”