Over the past year, we’ve continued to follow and investigate our existing top charities, and we’ve also looked for more outstanding giving opportunities. Today we are announcing our updated top charities:
1. Against Malaria Foundation (AMF). AMF focuses on distribution of insecticide-treated nets to prevent malaria; of all the charitable interventions we know of that have clear room for more funding, this one has the strongest evidence of effectiveness and cost-effectiveness. AMF has outstanding self-evaluation and transparency. It first became our #1 charity in late 2011 and has continued to impress us.
2. GiveDirectly. GiveDirectly’s goal: for every $1 it spends, deliver $0.90 directly into the hands of extremely poor people in the developing world, with no strings attached. We first wrote about GiveDirectly in 2011 when it was just getting off the ground, and we now have enough information from its first year to believe that it is succeeding in this goal, and is an outstanding young organization with extremely strong self-evaluation and transparency.
Our definition of “evidence of impact” includes evidence that “wealth is being transferred to low-income people.” We feel that direct cash transfers face an unusually low burden of proof because the link is so tight between cash transfers and giving additional wealth (and choice/empowerment) to recipients. That said, cash transfers have been more heavily studied than any other non-health intervention we know of. The evidence says that they increase short-term consumption, especially of food, and there is suggestive evidence that they may be invested at very high financial rates of return (e.g. ~20% per year). We are not as confident in the investment returns as we are in the evidence for some other interventions, especially bednets, but we believe that the case for increasing consumption on its own terms is strong. The many high-quality studies on cash transfers also provide little support for common concerns about such transfers (such as the idea that they are spent mostly on alcohol).
Different donors will come to different conclusions on the value of this outcome (directly increasing recipients’ wealth) as compared to health interventions, and cash has some salient strengths (putting choice in the hands of recipients) and weaknesses (potential harms if it is poorly spent) relative to health interventions. For our part, we would guess that our other two top charities’ interventions (taken in isolation from the organizations delivering them) do more good on a per-dollar basis, but we are not confident in this, and we see a strong case for supporting GiveDirectly.
3. Schistosomiasis Control Initiative (SCI). SCI focuses on deworming: treating people for parasitic infections. Deworming is extremely inexpensive (~$0.50 per person treated, including all costs), and there is evidence linking it with substantial developmental benefits (people dewormed in childhood may attend school more and earn more later in life); the evidence is not as strong as for insecticide-treated nets but is still far above what we’ve seen for most charitable interventions. We have at times struggled to understand SCI’s activities and impact, and are not as confident in the organization as a whole as in AMF and GiveDirectly, but overall it is an organization with an impressive track record and a strong commitment to transparency, and we consider it an outstanding giving opportunity.
We have published updated reviews of all three charities, as well as audio and a transcript from a conference call we did last week, at which we discussed our preliminary thinking about how to rank these charities with a group of especially involved GiveWell followers. We also give some initial thoughts in this post on the relative strengths and weaknesses of the three charities.
We plan to publish substantial additional content in the coming weeks that will give more context for the thinking behind our rankings. This will include updated reports on insecticide-treated nets, deworming and cash transfers, and blog posts going into more detail on how we see the major considerations (in particular, how the different interventions compare on cost-effectiveness and how we respond to common objections/concerns regarding cash transfers).
This year, more than in past years, our top charities have very different strengths and weaknesses, and we see substantial room for individual donors’ judgment calls in how much to give to each. We encourage donors to read on and review our take on this question. The rest of this post will (a) discuss what we’ve done over the last year that has led us to our current rankings; (b) lay out what we see as the major considerations regarding which of the above three charities to give to.
- Continued to follow AMF and SCI, which were our top two charities as of December 2011. We published the following updates:
- AMF: March and September 2012
- SCI: April and November 2012
Both made progress and continued to be highly transparent. We had an easier time understanding AMF’s activities (and the impact of GiveWell-sourced donations) than understanding SCI’s activities.
- Continued to investigate key questions about insecticide-treated nets and deworming.
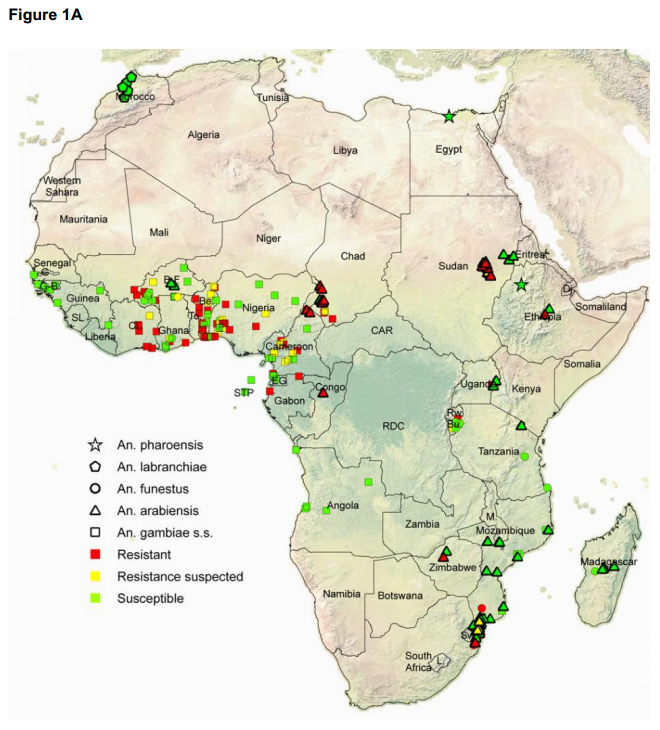
- Regarding insecticide-treated nets, we did a major internal vetting of our work and published a post revisiting the cost-effectiveness of this intervention; we also wrote about the possibility of insecticide resistance. Our big-picture stance on this intervention has not changed much – we still consider it an intervention with outstanding evidence of effectiveness and cost-effectiveness – though we have noted some new concerns and caveats.
- Regarding deworming, we published a post about a new systematic review of the evidence on deworming’s benefits, and we have a post forthcoming revisiting one of the major studies arguing that deworming has developmental benefits (i.e., that it leads to better outcomes later in life). We now find the short-term case for deworming’s health benefits to be weaker than we found it to be in 2011, and we find the long-term case for its developmental benefits to be stronger.
- Kept tabs on other promising organizations and did a thorough investigation of GiveDirectly. We have considered GiveDirectly promising since its launch, but only recently did we feel that it had enough of a track record to facilitate a deep assessment. In early October of this year, we determined that it was the most promising contender for a top-charity slot (aside from AMF and SCI); we completed a thorough investigation including multiple rounds of reviewing documents and interviewing its CEO; a more thorough investigation of the academic literature on cash transfers (writeup forthcoming); and a multiple-day visit to see GiveDirectly’s operations in Kenya.
- Looked for other outstanding giving opportunities in the area of global health and nutrition. As discussed earlier this year, we focused on finding ways to deliver the most promising interventions, rather than repeating our earlier approach of scanning a large list of charities. The two most promising interventions we looked into, immunizations and salt iodization, do not appear to have the sort of room for more funding that our top charities do (i.e., we do not see opportunities to translate additional dollars directly into additional people reached). We will be writing more about this in the future.
- If you are giving a large enough amount of money, it’s possible to hit diminishing returns by giving it all to one charity. A simple example is that if I were giving $1 billion this year, I wouldn’t give it all to AMF, because that amount would well exceed AMF’s room for more funding.
- A more subtle version of this idea pertains to learning opportunities. In a sense GiveWell is like a “large donor” with a few million dollars of anticipated money moved. If we direct major funding to more than one charity, we will have improved access to each such charity and will have improved opportunities to track its progress and learn from it. In addition, though we don’t anticipate moving enough money to overwhelm any of the three charities’ room for more funding, there is an argument that each marginal dollar means less to the charity in terms of improving its prominence, ability to experiment and plan, probability of turning out not to be able to scale further, etc.
- For donors who think of themselves as giving not only to help the charity in question but to help GiveWell, we encourage allocating your dollars in the same way that you would ideally like to see the broader GiveWell community allocate its dollars. If every GiveWell follower follows this principle, we’ll end up with an overall allocation that reflects a weighted average of followers’ opinions of the appropriate allocation. (By contrast, if every GiveWell follower reasons “My personal donation won’t hit diminishing returns, so I’ll just give exclusively to my top choice,” the overall allocation is more likely to end up “distorted.”)
We’ve polled GiveWell staff and core supporters on how they plan to allocate their own funds, and after considering these subjectively, we have settled on a recommended allocation of 70% to AMF, 20% to GiveDirectly, and 10% to SCI. However, we believe there is substantial room for judgment calls and value disagreements here, and we expect to see many individuals deviate significantly from this allocation due to their judgment calls and values. Our rough picture of the judgment calls and value choices that matter most is as follows.
| Program | Program evidence | Program cost-effectiveness | Our confidence in the organization | Potential for innovation /upside | |
|---|---|---|---|---|---|
| Against Malaria Foundation | Malaria control | Very strong | Very strong | Very high | High |
| Schisto-somiasis Control Initiative | Deworming (treating parasitic infections) | Fairly strong | Highly uncertain, though may be strongest | High | Low |
| Give Directly | Direct cash transfers to the very poor | Strong on short-term consumption; moderate on investment | Highly uncertain; may be strong | Very high | Very high |
For donors who place high value on supporting strong overall organizations (in light of the fact that much of the impact of a donation depends on who’s in charge of allocating it), and/or promoting innovation and experimentation, we suggest a relatively higher allocation to GiveDirectly, and lower to SCI.
- We believe that GiveDirectly has significant “upside”: it is experimenting with a type of intervention that is extremely rare in the nonprofit world, that it is hoping to experiment with many different approaches to this intervention, and that its approach may ultimately evolve and change significantly and may have a major impact on other parts of the nonprofit world.
- We believe AMF has significant “upside” as well, though in a different way (and probably to a lesser extent than GiveDirectly). Its intervention is one that has a large community around it and a lot of funding behind it. Through its unusual degree of transparency and self-evaluation, AMF may set examples for others and/or produce information/insights that are helpful to the broader malaria control community.
- While SCI is an outstanding organization, we do not believe it is as strong as the other two on this criterion.
For donors who are particularly “harm-averse” – such that they place significant weight on the “do no harm” principle as opposed to the “maximize expected good accomplished” principle (we subscribe to the latter) – we suggest a relatively lower allocation to GiveDirectly. Cash transfers (particularly as GiveDirectly structures them) have a higher risk of unintended consequences than the other two interventions. We see very little risk of harm for insecticide-treated nets or deworming.
For donors seeking to save rather than improve lives, we suggest a relatively higher allocation to AMF, the only charity of the three whose intervention has been linked with reduced mortality. For donors seeking to improve rather than save lives, we believe AMF should still get the highest allocation overall–the benefits of reducing the burden of malaria likely go well beyond saving lives. (GiveWell staff tend to prefer improving lives over saving them, and our suggested allocation takes this into account.)
For donors who are inclined to be less skeptical than we are of academic evidence and cost-effectiveness analysis, we suggest a relatively higher allocation to SCI, and lower to GiveDirectly. If one takes the evidence on deworming at face value, it indicates extremely impressive long-term benefits. Similar benefits may exist for reducing the burden of malaria, but deworming is substantially cheaper (~$0.50 per person per year, as opposed to ~$1.25) on a per-person basis.
For donors who are more skeptical than we are of academic evidence and cost-effectiveness analysis, and place a higher weight on the reasoning that “people are likely to make better decisions for themselves than we can make for them,” we recommend a relatively higher allocation to GiveDirectly.
We’ll be very interested to see what people end up doing. We encourage donors to post their planned allocations, and reasoning, as comments (or to email us if they’d prefer that their thinking stay private).