This is the final post (of five) we have made focused on our self-evaluation and future plans.
This post lays out highlights from our metrics report for 2012. For more detail, see our full metrics report (PDF).
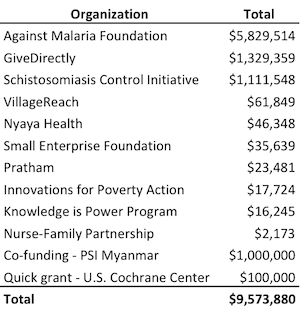
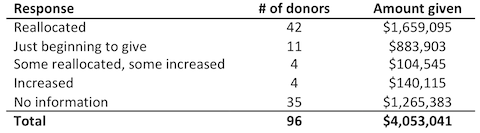
1. In 2012, GiveWell tracked $9.57 million in money moved based on our recommendations, a significant increase over past years.
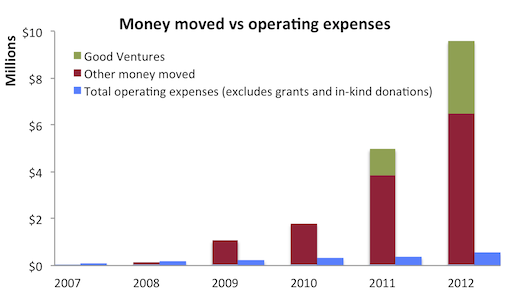
2. Our #1 charity received about 60% of the money moved and our #2 and #3 charities each received over $1 million as a result of our recommendation. Organizations that we designated “standouts” until November (when we decided not to use this designation anymore) received fairly small amounts. $1.1 million went to “learning grants” (details here and here) that GiveWell recommended to Good Ventures.
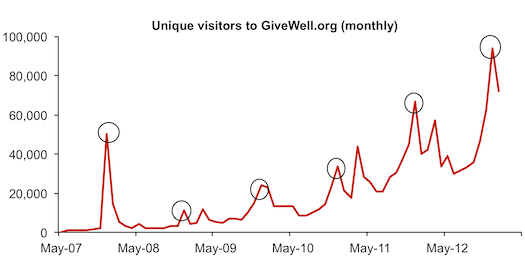
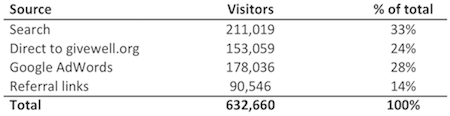
4. Web traffic continued to grow. A major driver of this growth was Google AdWords, which we received for free from Google as part of the Google Grants program. As in prior years, search traffic (both organic and AdWords) provided the majority of the traffic to the website. Traffic tends to peak in December of each year, circled in the chart below.
What effect has GiveWell had on your giving?
Comments
Well done, all.
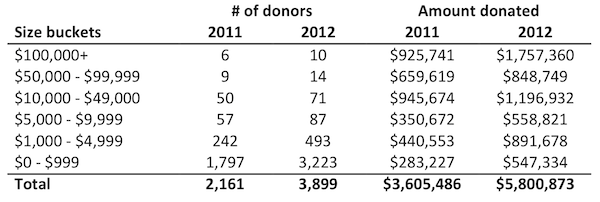
One statistic you may want to consider tracking: movement of donors from giving small amounts to larger amounts. It’s something that becomes more useful to understand over a long period of time, but would you’d need to begin collecting data now.
How do you account for funds that are donated to GiveWell, itself (either for re-granting or unrestricted)? Do you track them in the above based on how GiveWell re-grants them (to the degree they are re-granted)? Or do you exclude them entirely from the above?
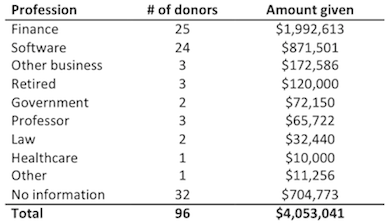
Brigid – thanks for the kind words and the suggestion. We currently collect donation information at the level of the individual and are able to follow how donors’ change their giving over time. We’ve shared this information (at an aggregated level) in the full metrics report, attached above, for donors who gave $10k+ in 2011 or 2012.
J S Greenfield – Funds that are given to GiveWell for re-granting are counted in the above figures based on how we granted them out. This year we granted 70% to AMF, 20% to GiveDirectly, and 10% to SCI, our recommended split. Unrestricted funds are not counted in the above. In the future, were we to reach our reserves limit, we would grant out unrestricted funds and then those grants would be counted in our money moved.
Note: This comment is mostly about measurements of total giving within the United States.
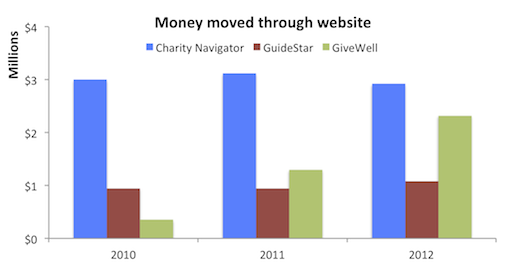
One thing that I didn’t initially understand is the discrepancy between the figure which is a bit above $6 million in the first graph, and then the approximately $2.5 million.
However, the report explains this. The $6 million is estimated from various other data including information from the top charities while I would assume that the $2.5 million is taken from data gathered by web software.
(another resource that could be posted is the actual figures that went into making the graphs — maybe this is available some place on the GiveWell web site already)
One question is where is the data from CharityNavigator and GuideStar coming from.
Another resource that is available and could be compared with the last graph is data available from GiveUSA on total giving.
I was curious for example on the figures for total charitable giving for 2010, 2011, and 2012 (say within the United States).
The last graph in the blog post shows perhaps about a 7 fold increase in money moved through the web site comparing 2010 and 2012.
GiveUSA seeks to estimate the total amount of giving to non-profit organizations within the United States.
I learned about it from GiveWell and in particular these blog posts:
A bit more detail on individual giving
The biggest giver: individuals
I don’t see the 2013 GiveUSA report for 2012 available yet, but the 2012 report for 2011 is available for free on the GiveUSA web site (one needs to set up an account).
http://store.givingusareports.org/
The full report costs $49.95.
One can then get estimates for the total amount of giving for 2009, 2010, and 2011.
In the GiveUSA executive summary one sees a figure of:
$298.42 billion
for total giving within the United States in 2011.
(page 4 of the document (page 8 of the PDF file)).
CharityNavigator has this same figure along with some explanation and interpretation:
http://www.charitynavigator.org/index.cfm?bay=content.view&cpid=42
For example, the largest percentage of donations (32%), goes to religious organization where a large proportion of that are people who are giving to their local place of worship.
Using page 12 of the executive summary (page 16 of the PDF) one can get estimates of total giving in the United States 2009, 2010, and 2011 (this is using current dollars although it is also computed adjusting for inflation a few pages later).
It lists percentage increase from 2009 to 2010 as:
4.5%
It lists percentage increase from 2010 to 2011 as:
4.0%
So:
2009 $274.59 billion ($286.94 / 1.045)
2010 $286.94 billion ($298.42 / 1.04)
2011 $298.42 billion
And not surprisingly one isn’t seeing anything like a 7 fold increase — consistent with what the blog post says about “due not to generalized increases in online giving or use of charity evaluators, but rather to GiveWell-specific factors.”
Blackbaud also has an index which seeks to measure how much money is donated as a “three-month moving average of year-over-year percent changes in giving”
The Blackbaud index seeks to measure not only total giving but also online giving.
https://www.blackbaud.com/page.aspx?pid=1025
Data indicates that online giving is increasing at a faster rate than total giving.
They also list four additional resources intended to help non-profits to determine how to structure their operations:
*Giving USA
*AFP Fundraising Effectiveness Survey
*Guidestar
*Quarterly Index of National Fundraising Performance
One comment is that Blackbaud speaks about measuring $8 billion in US-based Overall Giving from 3,000 organizations and $500 million in US-based Online Giving from 2,500 organizations.
(if you hover on Overall Giving and Online Giving on the index page)
https://www.blackbaud.com/nonprofit-resources/blackbaud-index
This is a lot smaller than the $298.42 billion figure from GiveUSA.
And according to the National Center for Charitable Statistics there are apparently 1.2 million non-profit organizations
http://nccsdataweb.urban.org/PubApps/profile1.php?state=US
Far more than the 3,000 making up the Blackbaud index.
It looks like the National Center for Charitable Statistics has data that GuideStar does not have.
For example, NCCS had the Form 990’s going back to 2002 for two organizations that I checked while GuideStar is only going back to 2009.
David Friedman
It is appreciable to get more and more charity from the donors which accounts much money
Money Site Lab Review
I e-mailed GiveUSA to find out when the 2013 report for giving in 2012 is going to be released. They wrote back and said it will be released on June 18th.
http://www.givingusareports.org/
David Friedman
Comments are closed.