Recently, we’ve been reflecting on and evaluating our past analysis of VillageReach. We’ve undertaken this analysis and published what we’ve learned because we feel that our process performed suboptimally, and careful consideration of what caused this may lead to improvement on our part.
Broadly, we categorize the problems below as “questions we could have asked to dig even deeper into VillageReach and its program.” The root cause of our failure to ask these questions came down to less context on international aid and a less thorough process than we have now. At the time we conducted most of our VillageReach analysis (2009 and 2010), we felt that our due diligence was sufficient – especially in light of many others (funders and charities) who told us that we were already digging deep enough and that our process was more intense than others they had seen. Today, we feel that a more thorough process is important. We feel that our research process has since advanced to a stage where we would effectively deal with each of the below issues in the course of our research process.
We were not sufficiently sensitive to the possibility that non-VillageReach factors might have led to the rise in immunization rates in Cabo Delgado; this caused us to overestimate the strength of the evidence for VillageReach’s impact
This issue is the main topic of the blog post we recently published on this topic, which describes what occurred in greater detail.
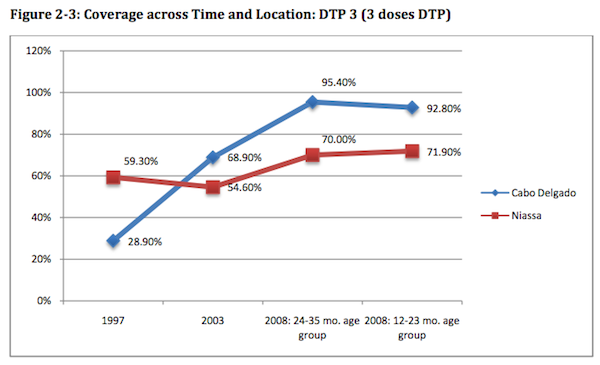
A key part of this issue was our analysis of the chart below, which compares changes in immunization rates in Niassa (where VillageReach did not work) to Cabo Delgado (where it did).
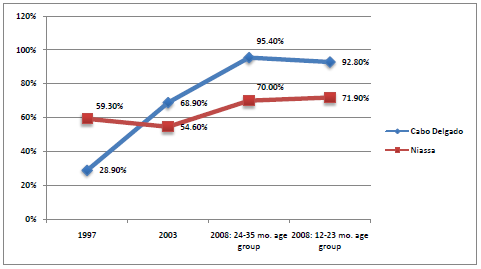
VillageReach’s evaluation presents the larger rise in Cabo Delgado relative to Niassa as suggestive evidence of VillageReach’s impact. We felt that the comparison provided limited evidence of impact. However, we did not ask (or if we asked, we have no record of asking or of VillageReach’s response) VillageReach about why Niassa experienced a large rise in immunization rates during the period of VillageReach’s pilot project. VillageReach was not active in Niassa at the time, and the fact that Niassa experienced a large increase in immunization coverage should have caused us to question whether VillageReach’s program, as opposed to other factors, caused the increase.
Over the last couple of years, we have had multiple experiences (some on the record, some off) with what we now call the “government interest confounder”: a quick and encouraging improvement on some metric coincides with a nonprofit’s entry into an area, but further analysis reveals that both could easily have been a product of the government’s increased interest in the issue the nonprofit works on. We are now keenly aware of this issue and always seek to understand what activities the government was undertaking at the time in question (something we previously were unable to do due to our greater difficulty getting access to the right people).
Note that we are not saying that the improvement in immunization coverage was due to government activities; we still find it possible that VillageReach was primarily responsible for the improvements. But we do find the case for the latter to be less conclusive than we thought it was previously.
We did not ask VillageReach for the raw data associated with the stockouts chart.
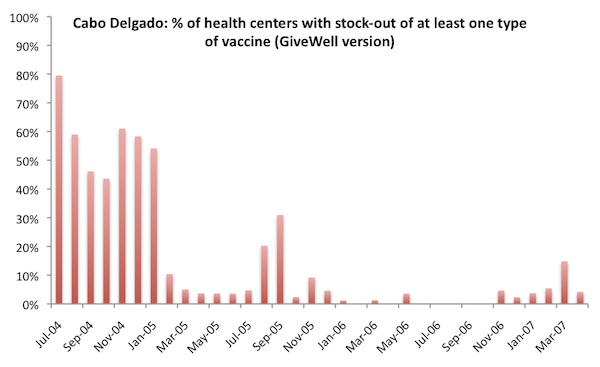
In our July 2009 VillageReach review, we copied a chart showing a fall in stockout rates from VillageReach’s evaluation of its pilot project into our review. (See chart here.)
In September 2011, we asked VillageReach for the raw data that they used to create the chart to further vet the accuracy of the data. Using the raw data, we recreated their chart, which matched the copied chart reasonably well. (See chart here.)
In our review of the raw data, we noticed that, in addition to data on stockouts, there was also data for “clinics with missing data.” Because missing data plausibly reflect “clinics with stockouts” (more discussion of this issue here), we created a second chart (which follows) that showed both stockouts and missing data.
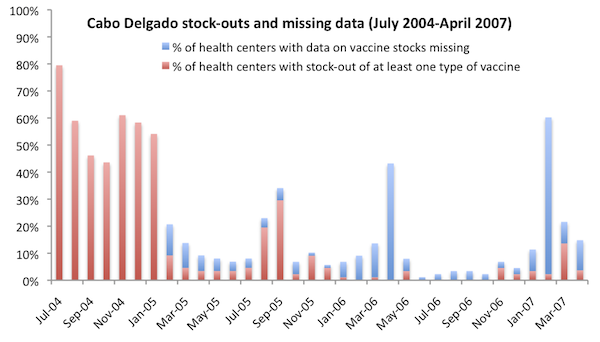
This chart presents a more complete picture of VillageReach’s success reducing stockout levels of vaccines at the clinics it served. During 2006, the year in which VillageReach reduced stockouts to near-zero levels, nearly half the year had significant levels of missing data. Having and reviewing all data in 2009 might have led us to ask additional questions such as: “Given that there’s evidence that VillageReach only succeeded in reducing stockouts to extremely low levels for a total of 6 months, how likely is it that it will be able to successfully scale its model to (a) new provinces while (b) using a less hands-on approach to implementing its program?”
We didn’t previously have a habit of asking for raw data behind key charts, but we have learned to do so after incidents such as our uncovering of major errors in an official cost-effectiveness estimate for deworming.
Ultimately, we felt that this particular chart held up fairly well under the raw-data-based examination. We still think it provides good evidence that VillageReach made a difference in this case. But it is a less strong case than we previously perceived it to be, and if we had been in the habit of asking for raw data we would have seen this earlier.
We misinterpreted data on immunization rates in Cabo Delgado following the end of VillageReach’s pilot project.
VillageReach’s baseline coverage study for Cabo Delgado stated, “There has been a reduction in vaccine coverage from 2008 to 2010 (children below 12 months of age) of nearly 18 percentage points” (VillageReach, “Vaccination Coverage Baseline Survey for Cabo Delgado Province,” Pg 31). We echoed this claim in March 2011, as part of our first VillageReach update (we wrote, “Overall immunization has fallen only slightly since the 2008 conclusion of VillageReach’s work in this province, but it has fallen significantly for children under the age of 12 months.”) Since then, we have concluded that we misinterpreted this data: while the percentage of children who were “fully immunized” fell between 2008 and 2010, other indicators of vaccine coverage (e.g., “fully vaccinated” and “DTP3” coverage) did not similarly fall.
We realized our error in early 2012 as we were working on further VillageReach updates (and we published the fact that we had erred in our latest update). This error occurred because we relied on the quote in VillageReach’s report (above) without fully tracing back the source data and recognizing the importance of the different vaccine indicators. On the other hand, other data has since become available that is consistent with our original reading (details in our previous post on the subject).
In a December 2009 blog post, we wrote that immunization rates had fallen after VillageReach’s project ended; instead, we should have written that stockout rates rose after VillageReach’s project ended.
In a blog post published on December 30, 2009, we wrote,
The fact that vaccination rates have since fallen is further evidence that VillageReach made a difference while they were there, but obviously discouraging relative to what they had hoped for.
This case was simply an error. Both Holden and I review each post before we publish it. In this case, Holden wrote it; I approved it; and the error got through.
I believe we knew at the time that we had no information about changes in immunization rates, only data on changes in stockout rates. Thus, I think this quote represents a small “communication error” rather than a large “error in understanding.”