As we wrote previously, we’re expecting to have a substantially revised set of charity recommendations by December 1. We’re currently in the final stages of writing up our cases for top contenders and discussing which will be top-rated. Because of this, we plan to suspend our blog posts (which are normally at least weekly) until then.
The GiveWell Blog
Maximizing cost-effectiveness via critical inquiry
We’ve recently been writing about the shortcomings of formal cost-effectiveness estimation (i.e., trying to estimate how much good, as measured in lives saved, DALYs or other units, is accomplished per dollar spent). After conceptually arguing that cost-effectiveness estimates can’t be taken literally when they are not robust, we found major problems in one of the most prominent sources of cost-effectiveness estimates for aid, and generalized from these problems to discuss major hurdles to usefulness faced by the endeavor of formal cost-effectiveness estimation.
Despite these misgivings, we would be determined to make cost-effectiveness estimates work, if we thought this were the only way to figure out how to allocate resources for maximal impact. But we don’t. This post argues that when information quality is poor, the best way to maximize cost-effectiveness is to examine charities from as many different angles as possible – looking for ways in which their stories can be checked against reality – and support the charities that have a combination of reasonably high estimated cost-effectiveness and maximally robust evidence. This is the approach GiveWell has taken since our inception, and it is more similar to investigative journalism or early-stage research (other domains in which people look for surprising but valid claims in low-information environments) than to formal estimation of numerical quantities.
The rest of this post
- Conceptually illustrates (using the mathematical framework laid out previously) the value of examining charities from different angles when seeking to maximize cost-effectiveness.
- Discusses how this conceptual approach matches the approach GiveWell has taken since inception.
I don’t wish to present this illustration either as official GiveWell analysis or as “the reason” that we believe what we do. This is more of an illustration/explication of my views than a justification; GiveWell has implicitly (and intuitively) operated consistent with the conclusions of this analysis, long before we had a way of formalizing these conclusions or the model behind them. Furthermore, while the conclusions are broadly shared by GiveWell staff, the formal illustration of them should only be attributed to me.
The model
Suppose that:
- Your prior over the “good accomplished per $1000 given to a charity” is normally distributed with mean 0 and standard deviation 1 (denoted from this point on as N(0,1)). Note that I’m not saying that you believe the average donation has zero effectiveness; I’m just denoting whatever you believe about the impact of your donations in units of standard deviations, such that 0 represents the impact your $1000 has when given to an “average” charity and 1 represents the impact your $1000 has when given to “a charity one standard deviation better than average” (top 16% of charities).
- You are considering a particular charity, and your back-of-the-envelope initial estimate of the good accomplished by $1000 given to this charity is represented by X. It is a very rough estimate and could easily be completely wrong: specifically, it has a normally distributed “estimate error” with mean 0 (the estimate is as likely to be too optimistic as too pessimistic) and standard deviation X (so 16% of the time, the actual impact of your $1000 will be 0 or “average”).* Thus, your estimate is denoted as N(X,X).
The implications
I use “initial estimate” to refer to the formal cost-effectiveness estimate you create for a charity – along the lines of the DCP2 estimates or Back of the Envelope Guide estimates. I use “final estimate” to refer to the cost-effectiveness you should expect, after considering your initial estimate and making adjustments for the key other factors: your prior distribution and the “estimate error” variance around the initial estimate. The following chart illustrates the relationship between your initial estimate and final estimate based on the above assumptions.
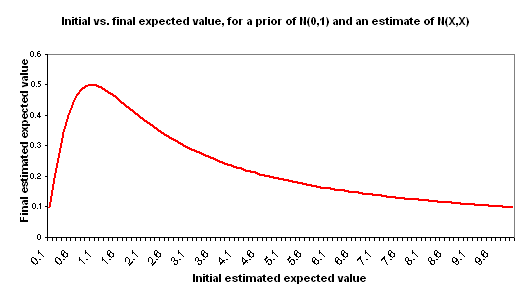
This is in some ways a counterintuitive result. A couple of ways of thinking about it:
- Informally: estimates that are “too high,” to the point where they go beyond what seems easily plausible, seem – by this very fact – more uncertain and more likely to have something wrong with them. Again, this point applies to very rough back-of-the-envelope style estimates, not to more precise and consistently obtained estimates.
- Formally: in this model, the higher your estimate of cost-effectiveness goes, the higher the error around that estimate is (both are represented by X), and thus the less information is contained in this estimate in a way that is likely to shift you away from your prior. This will be an unreasonable model for some situations, but I believe it is a reasonable model when discussing very rough (“back-of-the-envelope” style) estimates of good accomplished by disparate charities. The key component of this model is that of holding the “probability that the right cost-effectiveness estimate is actually ‘zero’ [average]” constant. Thus, an estimate of 1 has a 67% confidence interval of 0-2; an estimate of 1000 has a 67% confidence interval of 0-2000; the former is a more concentrated probability distribution.
Now suppose that you make another, independent estimate of the good accomplished by your $1000, for the same charity. Suppose that this estimate is equally rough and comes to the same conclusion: it again has a value of X and a standard deviation of X. So you have two separate, independent “initial estimates” of good accomplished, and both are N(X,X). Properly combining these two estimates into one yields an estimate with the same average (X) but less “estimate error” (standard deviation = X/sqrt(2)). Now the relationship between X and adjusted expected value changes:
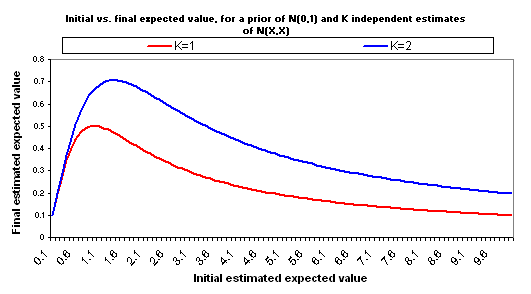
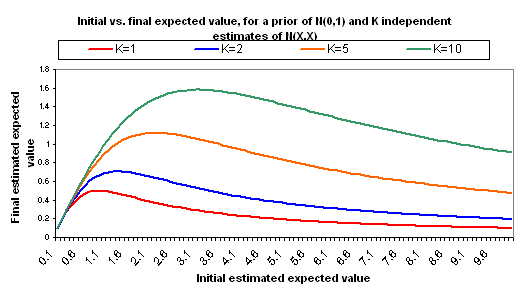
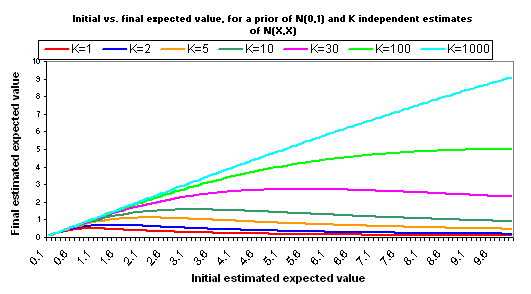
The following charts show what happens if you manage to collect even more independent cost-effectiveness estimates, each one as rough as the others, each one with the same midpoint as the others (i.e., each is N(X,X)).
A few other notes:
- The full calculations behind the above charts are available here (XLS). We also provide another Excel file that is identical except that it assumes a variance for each estimate of X/2, rather than X. This places “0” just inside your 95% confidence interval for the “correct” version of your estimate. While the inflection points are later and higher, the basic picture is the same.
- It is important to have a cost-effectiveness estimate. If the initial estimate is too low, then regardless of evidence quality, the charity isn’t a good one. In addition, very high initial estimates can imply higher potential gains to further investigation. However, “the higher the initial estimate of cost-effectiveness, the better” is not strictly true.
- Independence of estimates is key to the above analysis. In my view, different formal estimates of cost-effectiveness are likely to be very far from independent because they will tend to use the same background data and assumptions and will tend to make the same simplifications that are inherent to cost-effectiveness estimation (see previous discussion of these simplifications here and here).Instead, when I think about how to improve the robustness of evidence and thus reduce the variance of “estimate error,” I think about examining a charity from different angles – asking critical questions and looking for places where reality may or may not match the basic narrative being presented. As one collects more data points that support a charity’s basic narrative (and weren’t known to do so prior to investigation), the variance of the estimate falls, which is the same thing that happens when one collects more independent estimates. (Though it doesn’t fall as much with each new data point as it would with one of the idealized “fully independent cost-effectiveness estimates” discussed above.)
- The specific assumption of a normal distribution isn’t crucial to the above analysis. I believe (based mostly on a conversation with Dario Amodei) that for most commonly occurring distribution types, if you hold the “probability of 0 or less” constant, then as the midpoint of the “estimate/estimate error” distribution approaches infinity the distribution becomes approximately constant (and non-negligible) over the area where the prior probability is non-negligible, resulting in a negligible effect of the estimate on the prior.While other distributions may involve later/higher inflection points than normal distributions, the general point that there is a threshold past which higher initial estimates no longer translate to higher final estimates holds for many distributions.
number of people whose jobs produce the income necessary to give them and their families a relatively comfortable lifestyle (including health, nourishment, relatively clean and comfortable shelter, some leisure time, and some room in the budget for luxuries), but would have been unemployed or working completely non-sustaining jobs without the charity’s activities, per dollar per year. (Systematic differences in family size would complicate this.)
Early on, we weren’t sure of whether we would find good enough information to quantify these sorts of things. After some experience, we came to the view that most cost-effectiveness analysis in the world of charity is extraordinarily rough, and we then began using a threshold approach, preferring charities whose cost-effectiveness is above a certain level but not distinguishing past that level. This approach is conceptually in line with the above analysis.
It has been remarked that “GiveWell takes a deliberately critical stance when evaluating any intervention type or charity.” This is true, and in line with how the above analysis implies one should maximize cost-effectiveness. We generally investigate charities whose estimated cost-effectiveness is quite high in the scheme of things, and so for these charities the most important input into their actual cost-effectiveness is the robustness of their case and the number of factors in their favor. We critically examine these charities’ claims and look for places in which they may turn out not to match reality; when we investigate these and find confirmation rather than refutation of charities’ claims, we are finding new data points that support what they’re saying. We’re thus doing something conceptually similar to “increasing K” according to the model above. We’ve recently written about all the different angles we examine when strongly recommending a charity.
We hope that the content we’ve published over the years, including recent content on cost-effectiveness (see the first paragraph of this post), has made it clear why we think we are in fact in a low-information environment, and why, therefore, the best approach is the one we’ve taken, which is more similar to investigative journalism or early-stage research (other domains in which people look for surprising but valid claims in low-information environments) than to formal estimation of numerical quantities.
As long as the impacts of charities remain relatively poorly understood, we feel that focusing on robustness of evidence holds more promise than focusing on quantification of impact.
*This implies that the variance of your estimate error depends on the estimate itself. I think this is a reasonable thing to suppose in the scenario under discussion. Estimating cost-effectiveness for different charities is likely to involve using quite disparate frameworks, and the value of your estimate does contain information about the possible size of the estimate error. In our model, what stays constant across back-of-the-envelope estimates is the probability that the “right estimate” would be 0; this seems reasonable to me.
Some considerations against more investment in cost-effectiveness estimates
When we started GiveWell, we were very interested in cost-effectiveness estimates: calculations aiming to determine, for example, the “cost per life saved” or “cost per DALY saved” of a charity or program. Over time, we’ve found ourselves putting less weight on these calculations, because we’ve been finding that these estimates tend to be extremely rough (and in some cases badly flawed).
One can react to what we’ve been finding in different ways: one can take it as a sign that we need to invest more in cost-effectiveness estimation (in order to make it more accurate and robust), or one can take it as a sign that we need to invest less in cost-effectiveness estimation (if one believes that estimates are unlikely to become robust enough to take literally and that their limited usefulness can be achieved with less investment). At this point we are tentatively leaning more toward the latter view, this post lays out our thinking on why.
This post does not argue against the conceptual goal of maximizing cost-effectiveness, i.e., achieving the maximal amount of good per dollar donated. We strongly support this conceptual goal; rather, we are arguing that focusing on directly estimating cost-effectiveness is not the best way to maximize cost-effectiveness. We believe there are alternative ways of maximizing cost-effectiveness – in particular, making limited use of cost-effectiveness estimates while focusing on finding high-quality evidence (an approach we have argued for previously and will likely flesh out further in a future post).
In a nutshell, we argue that the best currently available cost-effectiveness estimates – despite having extremely strong teams and funding behind them – have the problematic combination of being extremely simplified (ignoring important but difficult-to-quantify factors), extremely sensitive (small changes in assumptions can lead to huge changes in the figures), and not reality-checked (large flaws can persist unchecked – and unnoticed – for years). We believe it is conceptually difficult to improve on all three of these at once: improving on the first two is likely to require substantially greater complexity, which in turn will worsen the ability of outsiders to understand and reality-check estimates. Given the level of resources that have been invested in creating the problematic estimates we see now, we’re not sure that really reliable estimates can be created using reasonable resources – or, perhaps, at all.
We expand on these points using the case study of deworming, the only DCP2 estimate that we have enough detail on to be able to fully understand and reconstruct.
- Costs: two possible figures for “cost per child treated,” one for generic drugs and one for name-brand drugs. These figures are drawn from a single paper (a literature review published 3 years prior to the publication of the estimate); costs are assumed to scale linearly with the number of children treated, and to be constant regardless of the region.
- Drug effectiveness: for each infection, a single “effectiveness” figure is used, i.e., treatment is assumed to reduce disease burden by a set percentage for a given disease. For each infection, a single paper is used as the source of this “effectiveness” figure.
- Symptoms averted: the prevalence of different symptoms is assumed to be different by region, but the regions are broad (there are 6 total regions). Prevalence figures are taken from a single paper. The severity of each symptom is assumed to be constant regardless of context, using standard disability weights. Effective treatment is presumed to prevent symptoms for exactly one year, with no accounting for externalities, side effects, or long-term effects (in fact, in the original calculation even deaths are assumed to be averted for only one year).
- Putting it all together: the estimate calculates benefits of deworming by estimating the number of children cured of each symptom for a single year (based on the six regional figures re: how common symptoms are), converting to DALYs using its single set of figures on how severe each symptom is, and multiplying by the single drug effectiveness figure. It divides these DALY-denominated benefits into the costs, which are again done using a single per-child figure.
No sensitivity analysis is included to examine how cost-effectiveness would vary if certain figures or assumptions turned out to be off. No adjustments are made to address issues such as (a) the high uncertainty of many of the figures (which has implications for overall cost-effectiveness); (b) the fact that figures are taken from a relatively small number of studies, and are thus likely to be based on unusually well-observed programs.
In our view, any estimate this simple and broad has very limited application when examining a specific charity operating in a specific context.
| Cost per DALY for STH treatment | Key assumptions behind this cost |
|---|---|
| $3.41 | original DCP2 calculation |
| $23.92 | +corrected disability weight of ascariasis symptoms |
| $256 | -corrected disability weight of ascariasis symptoms +corrected prevalence interpretation for all STHs and symptoms and disability weight of trichuriasis symptoms |
| $529 | +corrected disability weight of ascariasis symptoms |
| $385 | +incorrectly accounting for long-term effects |
| $326 | -incorrectly accounting for long-term effects +corrected duration of trichuriasis symptoms |
| $138 | +correctly accounting for long-term effects |
| $82.54 | Jonah’s independent estimate for, implicitly accounting for long-term effects and using lower drug costs |
Our final corrected version of the DCP2’s estimate varies heavily within regions as well:
| Cost per DALY for STH treatment | Region |
|---|---|
| $77.39 | East Asia & Pacific |
| $83.16 | Latin America & Caribbean |
| $412.22 | Middle East & North Africa |
| $202.69 | South Asian Seas |
| $259.57 | Sub-Saharan Africa |
So why wasn’t the error caught between its 2006 publication (and numerous citations) and our 2011 investigation? We can’t be sure, but we can speculate that
- The DALY metric – while it has the advantage of putting all health benefits in the same units – is unintuitive. We don’t believe it is generally possible to look at a cost-per-DALY figure and compare it with one’s informal knowledge of an intervention’s costs and benefits (though it is more doable when the benefits are concentrated in preventing mortality, which eliminates one of the major issues with interpreting DALYs).
- That means that in order to reality-check an estimate, one needs to look at the details of how it was calculated.
- But looking at the details of how an estimate is calculated is generally a significant undertaking – even for an estimate as simple as this one. It requires a familiarity with the DALY framework and with the computational tools being used (in this case Excel) that a subject matter expert – the sort of person who would be best positioned to catch major problems – wouldn’t necessarily have. And it may require more time than such a subject matter expert will realistically have available.
In most domains, a badly flawed calculation – when used – will eventually produce strange results and be noticed. In aid, by contrast, one can use a completely wrong figure indefinitely without ever finding out. The only mechanism for catching problems is to have a figure that is sufficiently easy to understand that outsiders (i.e., those who didn’t create the calculation) can independently notice what’s off. It appears that the DCP2 estimates do not pass this test.
Our point here isn’t about the apparent lack of formal double-check in the DCP2’s process (though this does affect our view of the DCP2) but about the lack of reality-check in the 5 years since publication – the fact that at no point did anyone notice that the figure seemed off, and investigate its origin.
And the problem pertains to more than “catching errors”; it also pertains to being able to notice when the calculation becomes out of line with (for example) new technologies, new information about the diseases and interventions in question, or local conditions in a specific case. An estimate that can’t be – or simply isn’t – continually re-examined for its overall and local relevance may be “correct,” but its real-world usefulness seems severely limited.
Improving the robustness and precision of the estimates would likely have to mean making them far more complex, which in turn could make it far more difficult for outsiders (including subject matter experts) to make sense of them, adapt them to new information and local conditions, and give helpful feedback.
The resources that have already been invested in these cost-effectiveness estimates are significant. Yet in our view, the estimates are still far too simplified, sensitive, and esoteric to be relied upon. If such a high level of financial and (especially) human-capital investment leaves us this far from having reliable estimates, it may be time to rethink the goal.
All that said – if this sort of analysis were the only way to figure out how to allocate resources for maximal impact, we’d be advocating for more investment in cost-effectiveness analysis and we’d be determined to “get it right.” But in our view, there are other ways of maximizing cost-effectiveness that can work better in this domain – in particular, making limited use of cost-effectiveness estimates while focusing on finding high-quality evidence (an approach we have argued for previously and will likely flesh out further in a future post).
GiveWell is aiming to have a new #1 charity by December
Our current top-rated charity is VillageReach. In 2010, we directed over $1.1 million to it, which met its short-term funding needs (i.e., its needs for the next year or so).
VillageReach still has longer-term needs, and in the absence of other giving opportunities that we consider comparable, we’ve continued to feature it as #1 on our website. However, we’ve also been focusing most of our effort this year on identifying and investigating other potential top-rated charities, with the hope that we can refocus attention on an organization with shorter-term needs this December. (In general, the vast bulk of our impact on donations comes in December.) We believe that we will be able to do so. We don’t believe we’ll be able to recommend a giving opportunity as good as giving to VillageReach was last year, but given VillageReach’s lack of short-term (1-year) room for more funding, we do expect to have a different top recommendation by this December.
We haven’t been updating our rankings continuously; we prefer to do very deep investigations of top contenders, and aim for an all-at-once refresh in time for December. This is largely because we’ve continued to raise the bar for what it takes to become a top charity. For example, since we’ve found field visits to be useful, we now have a strong preference to avoid naming a charity “top-rated” before we’ve seen its work on the ground (for this reason, staff is currently split up between Malawi and India, visiting contender charities; we will post notes and pictures after we return and get the content approved by charities we’ve visited). More generally, we are looking to examine a charity from many different angles and have a high level of confidence before we start directing significant funds to it.
Bottom line – by December, we will have a new “top-rated” charity. This is not a “demotion” of VillageReach; rather, it reflects our success in directing enough funding to it to close its short-term gap.
What it takes to evaluate impact
When someone asks me what makes GiveWell different from other third-party charity evaluators, I often answer by listing all the things we’ve done in order to investigate our current top-rated charity, VillageReach.
- We’ve done extensive background research on international aid and argued for key takeaways such as the overall promise of international aid for donors, the particular promise of health aid, and, within health aid, the particular promise of immunization-focused programs (such as VillageReach’s).
- We’ve written up a comprehensive discussion of VillageReach’s different projects, the funders behind them, the funds allocated to them and what we know about their impact.
- We’ve examined VillageReach’s evidence for the effectiveness of its pilot project, listed and examined possible objections to this evidence, discussed these objections with staff and investigated staff’s responses.
- We’ve created multiple estimates of how much VillageReach’s activities cost per life saved.
- We’ve closely tracked VillageReach’s room for more funding and its expansion plan, and continually updated our analysis on these points as its plans and revenues have changed.
- We’ve spent several days with VillageReach staff in Mozambique (the site of its major project) and posted notes, reflections, pictures, and audio recordings of conversations.
- We’ve also visited VillageReach’s U.S. headquarters in Seattle, and we will soon be visiting the other site where VillageReach has a significant field presence, in Malawi.
- We’ve spoken to other funders of VillageReach, and to funders who have considered but ultimately declined funding VillageReach.
- Starting this year (following our moving over $1 million to VillageReach in 2010, most of it in late 2010), we’ve been posting quarterly updates on the progress of VillageReach’s work in Mozambique and the extent to which more donations are needed/warranted. We intend to continue these updates even if we stop recommending donations to VillageReach (which we expect to do shortly given the fact that it does not currently have a short-term funding need), since we want to learn how our recommendation turns out.
All in all, we’ve spent hundreds of hours examining VillageReach – yet we still feel very far from being “settled” on the question of how promising its activities are. Like any outstanding opportunity to do good, VillageReach’s work involves large and complex challenges. We’ll never have 100% of the relevant information or 100% certainty on its merits, but because we’ve recommended VillageReach so highly and moved over $1 million to it, it’s important to us that we do the best we can.
It isn’t realistic to do this kind of in-depth investigation for thousands (or even hundreds) of charities. We have to save our resources for the most promising charities if we want to have a reasonable level of confidence in our top recommendations. That means we take shortcuts on less promising charities, and we don’t put in the work it would take to distinguish between “worst,” “bad,” “mediocre” and “decent” groups – we’re laser-focused on the ones that we consider “best.”
Other independent charity evaluators tend to measure themselves by how many charities they rate. They exist largely for donors who already know where they want to give, and want a basic legitimacy check before they finalize the donation. To accommodate this goal, these other evaluators need to be far less thorough and more simplified than we are. That means – in our view – that they have no realistic chance of ever meaningfully rating impact, i.e., the degree to which a charity is succeeding at its mission.
GiveWell isn’t for everyone. Donors looking to check the charity they already want to give to are better off with other resources. But for donors who don’t already have a charity in mind and are looking to maximize their impact, we don’t know of any other group that provides a comparable product.
GiveWell Labs: Our criteria for giving opportunities
[Added August 27, 2014: GiveWell Labs is now known as the Open Philanthropy Project.]
We’re starting a new initiative, GiveWell Labs, an arm of our research process that will be open to any giving opportunity, no matter what form and what sector.
This post lays out, very broadly, what qualities we are looking for in giving opportunities. Future posts will elaborate on each of these criteria, and we will also discuss how we think these criteria apply to specific areas of philanthropy. Readers will hopefully be left with a strong sense of our beliefs and biases and what we’re looking for.
The main things we’re looking for in a giving opportunity are:
- Upside: we’d prefer to fund projects that have the potential to go extremely well. Projects aiming to demonstrate a model that can be scaled up, generate new scientific knowledge that can be used by many others, or put a program in place that eventually becomes self-sustaining independent of philanthropic support all have “upside.” Simply aiming to deliver insecticide-treated nets using established delivery methods does not have much “upside” (though it may score well on many of these other criteria).
- High likelihood of success: we’d prefer to fund projects that are very likely to do a respectable amount of good per dollar. The “evidence base” of a project – i.e., the set of past well-understood events that can be used to put its likelihood of success in context – is key here. Obviously this criterion will often be in tension with the “upside” criterion; the ideal for us is a project that has both, i.e., a project that’s both very likely to do some good and has some possibility of doing enormous amounts of good (we think that giving to VillageReach in 2010 fit into this category).
- Accountability. We’re OK with funding a project that might fail, but it’s very important to us that we be able to recognize, document, publicly discuss, and learn from such a failure if it happens. We thus have a strong preference to fund projects with specific and meaningful deliverables that will give us a strong sense of whether things are going as hoped (as well as permission to publish updates on these deliverables).We are relatively new to giving and plan to be doing a lot more of it in the future, so making sure that early projects are learning opportunities is crucial.
- People we’re confident in. We prefer to fund projects where we are impressed by and confident in the people involved. However, our take on how to evaluate people seems to be different from that of some other funders; we’ll elaborate in a future post.
- Room for more funding. We prefer to fund projects that would not happen without our funding. This means that we aren’t actually looking for the “best ways to spend philanthropic funds”; we’re looking for the “best ways to spend philanthropic funds that aren’t already on the agendas of other funders.”
We don’t have an explicit formula for weighing the above criteria above against each other. Broadly speaking, we’d prefer to fund an opportunity that is strong on all of the following: (a) at least one of #1 and #2; (b) at least one of #3 and #4; (c) #5. (Note that we do not feel the approach of estimating ‘expected good accomplished’ for each project, and simply ranking by this metric, is a good way to maximize actual expected good accomplished; for more, see the body and comments of a recent post on expected-value calculations.)
One more consideration is leverage: we prefer projects where our funding mobilizes more funding from other givers as well, thus multiplying the impact of our funds in some sense. However, we think this is far less important than the criteria listed above. We’d rather fund a great project all on our own, and leave other funders to spend on their own projects, than get a 5:1 or 100:1 funding match from others on a project that is weak on the above criteria.
If you think we’re missing any important impact-related criteria, please let us know.